Get Certified for Financial Modeling (FMVA)®
Gain in-demand industry knowledge and hands-on practice that will help you stand out from the competition and become a world-class financial analyst.
The rate of return a shareholder requires for investing equity
Over 1.8 million professionals use CFI to learn accounting, financial analysis, modeling and more. Start with a free account to explore 20+ always-free courses and hundreds of finance templates and cheat sheets.
Cost of Equity is the rate of return a company pays out to equity investors. A firm uses cost of equity to assess the relative attractiveness of investments, including both internal projects and external acquisition opportunities. Companies typically use a combination of equity and debt financing, with equity capital being more expensive.
The cost of equity can be calculated by using the CAPM (Capital Asset Pricing Model) or Dividend Capitalization Model (for companies that pay out dividends).
CAPM takes into account the riskiness of an investment relative to the market. The model is less exact due to the estimates made in the calculation (because it uses historical information).
CAPM Formula:
E(Ri) = Rf + βi * [E(Rm) – Rf]
Where:
The return expected from a risk-free investment (if computing the expected return for a US company, the 10-year Treasury note could be used).
The measure of systematic risk (the volatility) of the asset relative to the market. Beta can be found online or calculated by using regression: dividing the covariance of the asset and market’s returns by the variance of the market.
βi < 1: Asset i is less volatile (relative to the market)
βi = 1: Asset i’s volatility is the same rate as the market
βi > 1: Asset i is more volatile (relative to the market)
This value is typically the average return of the market (which the underlying security is a part of) over a specified period of time (five to ten years is an appropriate range).
The Dividend Capitalization Model only applies to companies that pay dividends, and it also assumes that the dividends will grow at a constant rate. The model does not account for investment risk to the extent that CAPM does (since CAPM requires beta).
Dividend Capitalization Formula:
Re = (D1 / P0) + g
Where:
Companies usually announce dividends far in advance of the distribution. The information can be found in company filings (annual and quarterly reports or through press releases). If the information cannot be located, an assumption can be made (using historical information to dictate whether the next year’s dividend will be similar).
The share price of a company can be found by searching the ticker or company name on the exchange that the stock is being traded on, or by simply using a credible search engine.
The Dividend Growth Rate can be obtained by calculating the growth (each year) of the company’s past dividends and then taking the average of the values.
The growth rate for each year can be found by using the following equation:
Dividend Growth = (Dt/Dt-1) – 1
Where:
Below are the dividend amounts paid every year by a company that has been operating for five years.
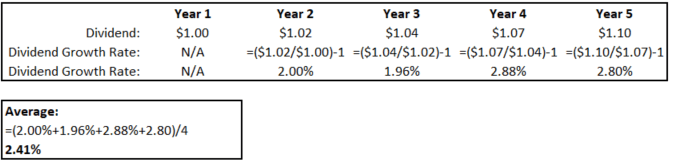
The average of the growth rates is 2.41%.
XYZ Co. is currently being traded at $5 per share and just announced a dividend of $0.50 per share, which will be paid out next year. Using historical information, an analyst estimated the dividend growth rate of XYZ Co. to be 2%. What is the cost of equity?
Re = ($0.50/$5) + 2%
Re = 12%
The cost of equity for XYZ Co. is 12%.
Step 1: Find the RFR (risk-free rate) of the market
Step 2: Compute or locate the beta of each company
Step 3: Calculate the ERP (Equity Risk Premium)
ERP = E(Rm) – Rf
Where:
Step 4: Use the CAPM formula to calculate the cost of equity.
E(Ri) = Rf + βi*ERP
Where:
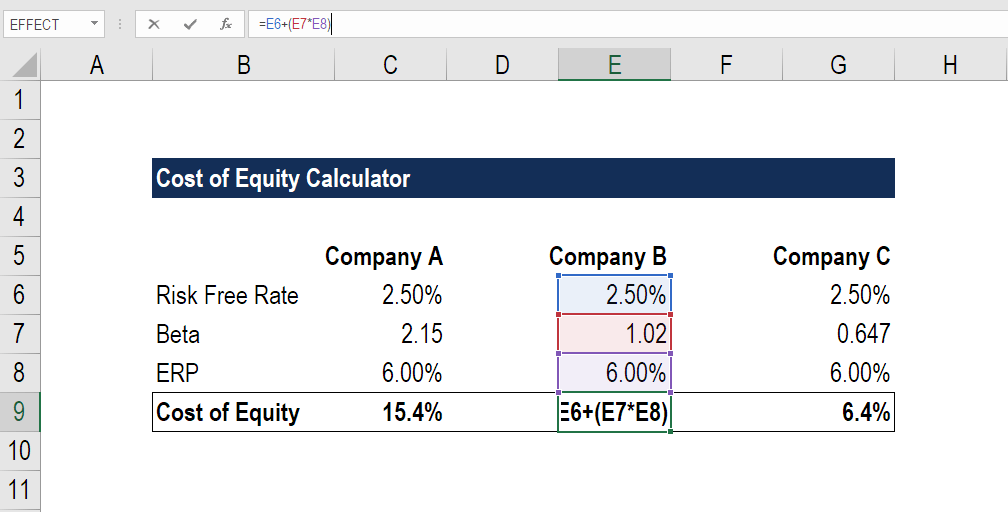
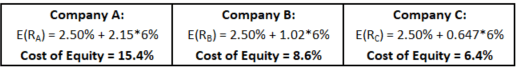
The company with the highest beta sees the highest cost of equity and vice versa. It makes sense because investors must be compensated with a higher return for the risk of more volatility (a higher beta).
Enter your name and email in the form below and download the free template now!
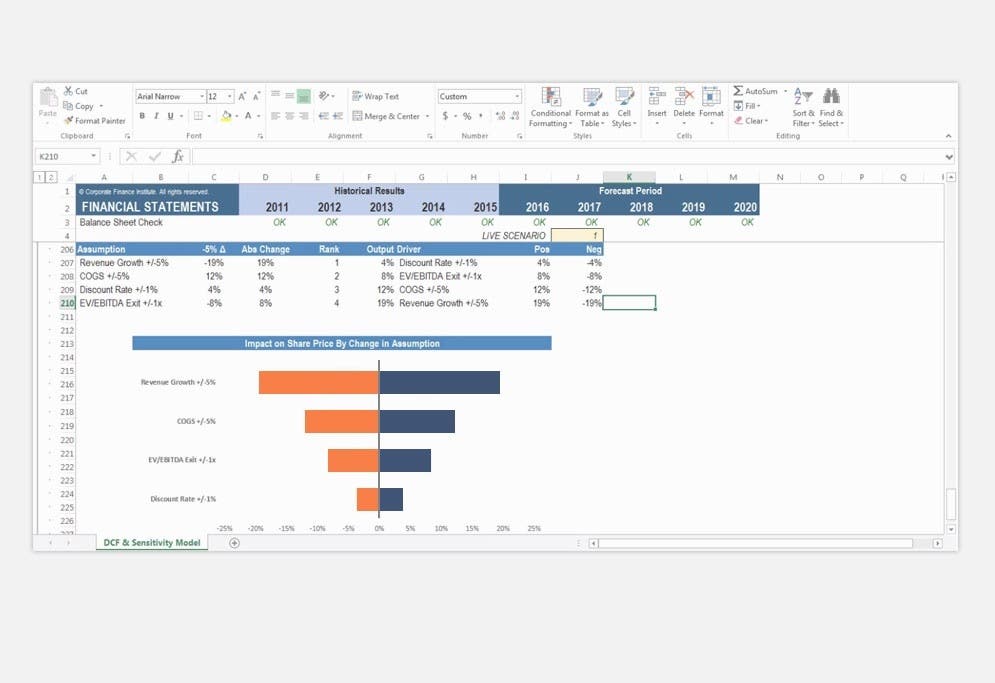
Download the free Excel template now to advance your finance knowledge!
The cost of equity is often higher than the cost of debt. Equity investors are compensated more generously because equity is riskier than debt, given that:
The cost of equity applies only to equity investments, whereas the Weighted Average Cost of Capital (WACC) accounts for both equity and debt investments.
Cost of equity can be used to determine the relative cost of an investment if the firm doesn’t possess debt (i.e., the firm only raises money through issuing stock).
The WACC is used instead for a firm with debt. The value will always be cheaper because it takes a weighted average of the equity and debt rates (and debt financing is cheaper).
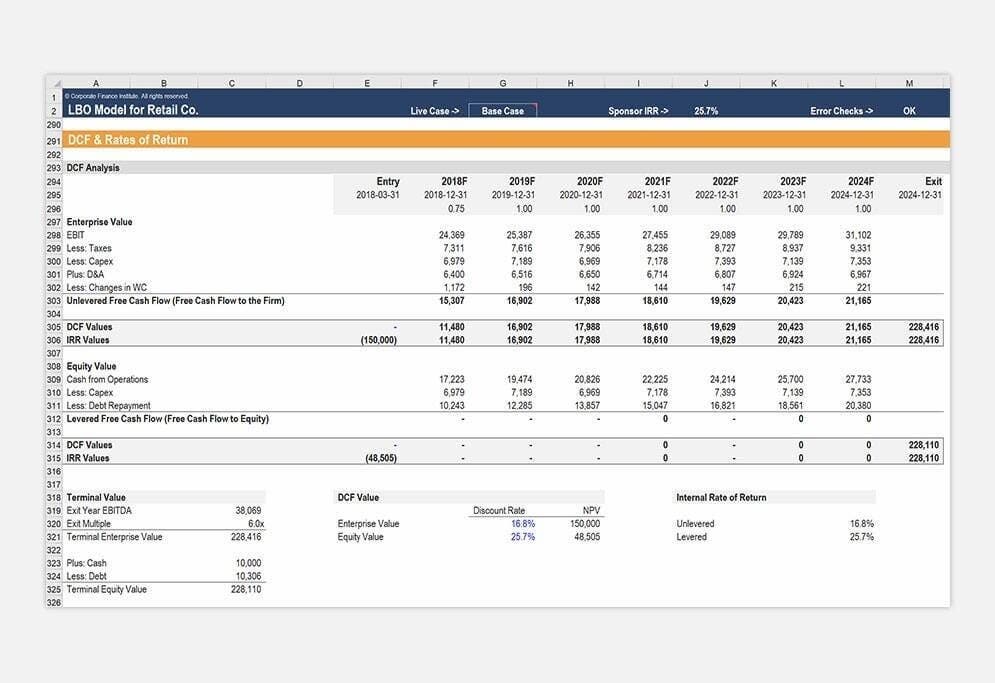
WACC is typically used as a discount rate for unlevered free cash flow (FCFF). Since WACC accounts for the cost of equity and cost of debt, the value can be used to discount the FCFF, which is the entire free cash flow available to the firm. It is important to discount it at the rate it costs to finance (WACC).
Cost of equity can be used as a discount rate if you use levered free cash flow (FCFE). The cost of equity represents the cost to raise capital from equity investors, and since FCFE is the cash available to equity investors, it is the appropriate rate to discount FCFE by.
CFI is a global provider of financial modeling certification programs for aspiring financial analysts working in investment banking, equity research, corporate development, and FP&A. To continue advancing your career, these additional CFI resources will be helpful: