Aroon Indicator – Technical Analysis
Aroon-Up (bullish indicator) and Aroon-Down (bearish indicator)
Over 1.8 million professionals use CFI to learn accounting, financial analysis, modeling and more. Start with a free account to explore 20+ always-free courses and hundreds of finance templates and cheat sheets.
What is the Aroon Indicator?
The Aroon indicator, developed by Tushar Chande in 1995, actually consists of two indicators that together are designed to:
- Identify trend changes or the beginning of a trend
- Identify the existence of a trending or ranging market
- Spot corrective retracements or consolidation periods
- Gauge the strength of a trend
The two Aroon indicators are the Aroon-Up and Aroon-Down, sometimes referred to as the bullish Aroon and bearish Aroon. The Aroon-Up indicator reflects the number of days since the most recent 25-day high. The Aroon-Down indicator shows the number of days since the most recent 25-day low.
The Aroon indicators take rather an inverse stance compared to the usual momentum oscillators, as the Aroon focus is more on time relative to price rather than price relative to time.
Calculating Aroon Indicators
The Aroon Indicators are plotted in a separate window from the main chart window that shows price action and are figured in percentage terms with values ranging from 0 to 100.
The Aroon-Up indicator is calculated as follows:
25 – Number of Days Since Recent 25-day High / 25
The Aroon-Down indicator is calculated as follows:
25 – Number of Days Since Recent 25-day Low / 25
The results of both calculations are then multiplied by 100 to yield a percentage number.
Understanding What the Aroon Indicator Shows
The two Aroon indicators are basically tracking, respectively, when the most recent highs and lows occurred. Higher values for the Aroon indicators reflect a more recently occurring high or low, and lower Aroon values reflect a more distantly occurring high or low.
Higher Aroon values indicate a stronger trend, with lower values indicating a weaker trend or the absence of a trend.
Looking at the chart below, you can easily see around the middle of the chart where the Aroon-Up indicator line (shown in red) crosses up over the Aroon-Down indicator line (shown in blue), correctly indicating a bullish trend.
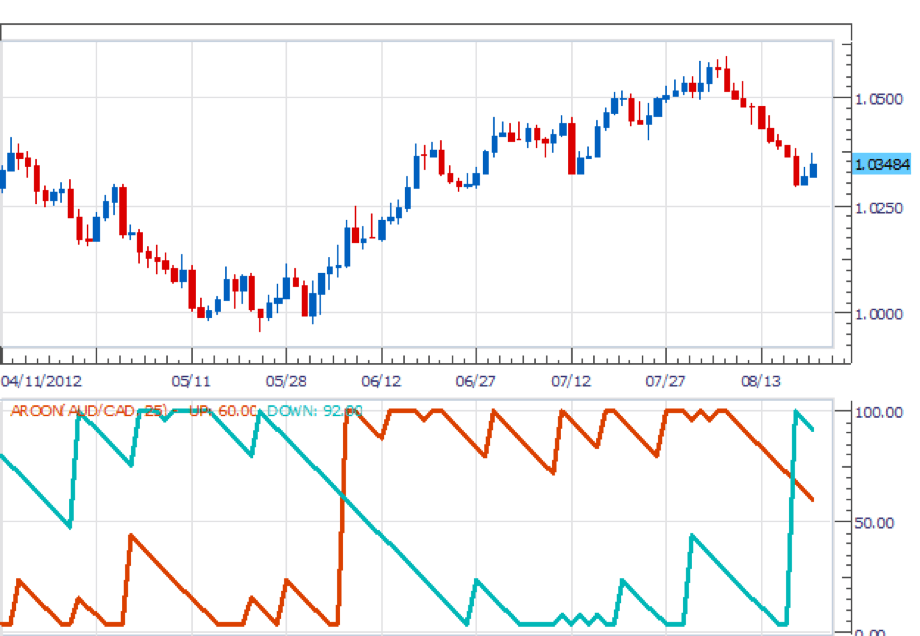
Cautionary Note: A glance at the far right-hand side of the chart shows that a bearish Aroon indicator crossover is rather late in signaling a trend change from bullish to bearish, not occurring until after nine down days in a row in the market, during which price had already fallen substantially.
However, a trader might have taken the downturn of the Aroon-Up indicator as a sign of the uptrend weakening and, combined with looking at price action, decided to make a judicious exit from the market prior to the actual Aroon-Up/Aroon-Down bearish crossover.
The Single Line Aroon Indicator
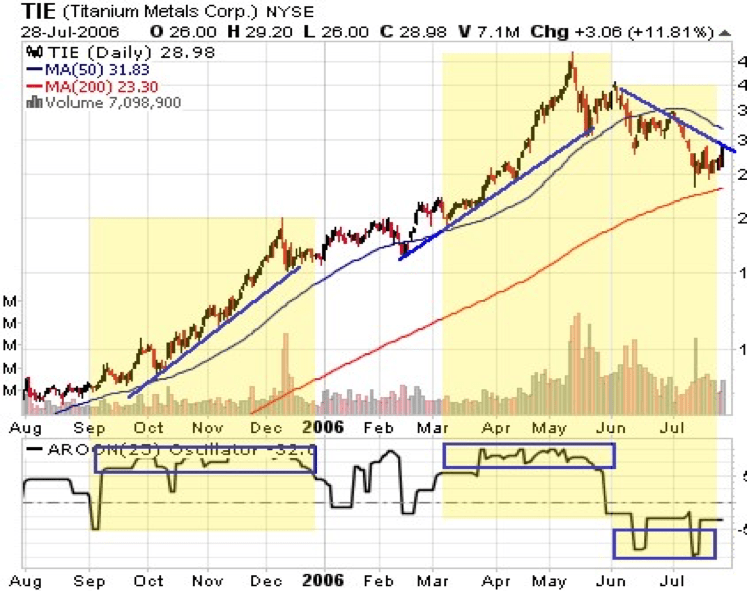
Some versions of the Aroon combine the two indicators into a single Aroon indicator that, like other oscillators, has values ranging from -100 to +100. In the single indicator version of the Aroon, values around the middle zero line indicate the absence of a trend, a market that is ranging or in a consolidation phase prior to forming a trend. Values above +50 indicate a bullish trend and values below -50 indicate a bearish trend.
The single version of the Aroon is shown in the chart below. Dark blue rectangular boxes are drawn around the Aroon indicator line to show where it reaches levels either above +50 or below -50. Note how price action, either staying above or falling below the uppermost trendline drawn in the main chart window confirms the change in the direction indicated by the Aroon indicator.
Also, note the additional confirmation of a trend change that comes from the extremely high volume levels (shown at the bottom of the main chart window) that occur at the peak of the uptrend and the beginning of the sell-off. The dotted line in the middle of the Aroon indicator window is the zero line.
Using the Aroon Indicators
Market analysts and traders can obtain a number of trading signals from the Aroon indicators.
Trading signals can be obtained from Aroon crossovers. Crossovers of the two Aroon indicators, either the Aroon-Up indicator making a bullish crossover above the Aroon-Down indicator, or the Aroon-Down indicator making a bearish crossover to above the Aroon-Up indicator, are generally interpreted as trend change or market reversal signals.
However, as with most momentum oscillator indicators, the Aroon is prone to generating false signals during volatile, choppy trading action. Therefore, traders are wise to look for confirming price and volume action rather than acting based on the Aroon indicator alone.
Trading signals can also come from high Aroon values. In the two-indicator version of the Aroon, values above 70 and nearer 100 indicate a strong trend. Conversely, Aroon values of 30 or below indicate a weak trend. As already stated, in the single-indicator version of the Aroon, strong trends are indicated by values greater than +50 or -50.
Paradoxically, very high Aroon values, right at or very near 100, are sometimes interpreted as early warning signals of an upcoming trend change or corrective market reversal. If the Aroon-Up value remains at or near 100, this is interpreted by some market analysts as indicating overbought conditions in a market that make a sell-off likely. If the Aroon-Down indicator stays around 100 for several time periods, this may be interpreted to represent oversold conditions in a market, thereby presaging a rally to the upside.
Again, traders are advised to look for confirming signals from price or volume action. Although sustained high Aroon values do often indicate overbought or oversold conditions in a market, most experienced traders know that a market can remain in a technically overbought or oversold condition for some time, with price continuing to move significantly in the direction of the existing trend before any corrective retracement in the opposite direction begins.
The two Aroon indicators are used to identify ranging or consolidating markets when the two indicator lines run parallel to each other – or in the single-indicator version of the Aroon when values remain at or near the zero line. In such market conditions, traders typically stand aside until changes in the Aroon indicator’s movements, along with price action and/or increases in volume, clearly indicate the beginning or resumption of a trend.
Conclusion – A Confirming or Filtering Indicator
The Aroon indicator can be profitably used as a confirming indicator along with other technical indicators of a bullish or bearish trend or as an indication of a possible upcoming market reversal. It can also be used as a trade filter to help traders avoid taking positions in volatile or ranging markets.