Get Certified for
Capital Markets (CMSA®)
From equities, fixed income to derivatives, the CMSA certification bridges the gap from where you are now to where you want to be — a world-class capital markets analyst.
The expected value of the distribution of returns from an investment
Over 1.8 million professionals use CFI to learn accounting, financial analysis, modeling and more. Start with a free account to explore 20+ always-free courses and hundreds of finance templates and cheat sheets.
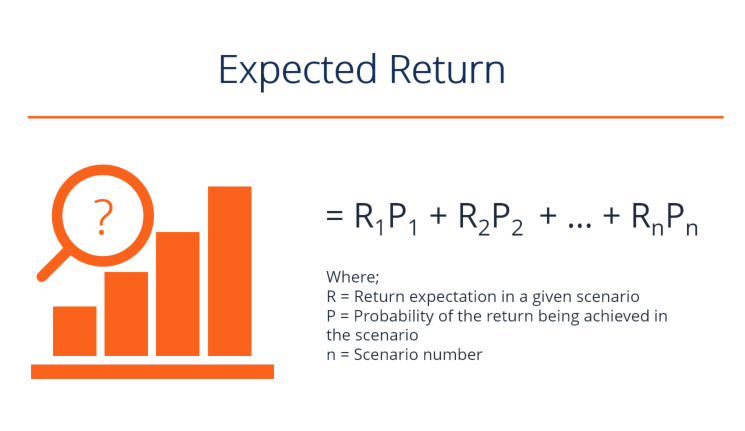
The expected return on an investment is the expected value of the probability distribution of possible returns it can provide to investors. The return on the investment is an unknown variable that has different values associated with different probabilities. Expected return is calculated by multiplying potential outcomes (returns) by the chances of each outcome occurring, and then calculating the sum of those results (as shown below).
In the short term, the return on an investment can be considered a random variable that can take any values within a given range. The expected return is based on historical data, which may or may not provide reliable forecasting of future returns. Hence, the outcome is not guaranteed. Expected return is simply a measure of probabilities intended to show the likelihood that a given investment will generate a positive return, and what the likely return will be.
The purpose of calculating the expected return on an investment is to provide an investor with an idea of probable profit vs risk. This gives the investor a basis for comparison with the risk-free rate of return. The interest rate on 3-month U.S. Treasury bills is often used to represent the risk-free rate of return.
For a given random variable, its probability distribution is a function that shows all the possible values it can take. It is confined to a certain range derived from the statistically possible maximum and minimum values.
Distributions can be of two types: discrete and continuous. Discrete distributions show only specific values within a given range. A random variable following a continuous distribution can take any value within the given range. Tossing a coin has two possible outcomes and is thus an example of a discrete distribution. A distribution of the height of adult males, which can take any possible value within a stated range, is a continuous probability distribution.

Enter your name and email in the form below and download the free template now!
Download the free Excel template now to advance your finance knowledge!
Let us take an investment A, which has a 20% probability of giving a 15% return on investment, a 50% probability of generating a 10% return, and a 30% probability of resulting in a 5% loss. This is an example of calculating a discrete probability distribution for potential returns.
The probabilities of each potential return outcome are derived from studying historical data on previous returns of the investment asset being evaluated. The probabilities stated, in this case, might be derived from studying the performance of the asset over the previous 10 years. Assume that it generated a 15% return on investment during two of those 10 years, a 10% return for five of the 10 years, and suffered a 5% loss for three of the 10 years.
The expected return on investment A would then be calculated as follows:
Expected Return of A = 0.2(15%) + 0.5(10%) + 0.3(-5%)
(That is, a 20%, or .2, probability times a 15%, or .15, return; plus a 50%, or .5, probability times a 10%, or .1, return; plus a 30%, or .3, probability of a return of negative 5%, or -.5)
= 3% + 5% – 1.5%
= 6.5%
Therefore, the probable long-term average return for Investment A is 6.5%.
Calculating expected return is not limited to calculations for a single investment. It can also be calculated for a portfolio. The expected return for an investment portfolio is the weighted average of the expected return of each of its components. Components are weighted by the percentage of the portfolio’s total value that each accounts for. Examining the weighted average of portfolio assets can also help investors assess the diversification of their investment portfolio.
To illustrate the expected return for an investment portfolio, let’s assume the portfolio is comprised of investments in three assets – X, Y, and Z. $2,000 is invested in X, $5,000 invested in Y, and $3,000 is invested in Z. Assume that the expected returns for X, Y, and Z have been calculated and found to be 15%, 10%, and 20%, respectively. Based on the respective investments in each component asset, the portfolio’s expected return can be calculated as follows:
Expected Return of Portfolio = 0.2(15%) + 0.5(10%) + 0.3(20%)
= 3% + 5% + 6%
= 14%
Thus, the expected return of the portfolio is 14%.
Note that although the simple average of the expected return of the portfolio’s components is 15% (the average of 10%, 15%, and 20%), the portfolio’s expected return of 14% is slightly below that simple average figure. This is due to the fact that half of the investor’s capital is invested in the asset with the lowest expected return.
In addition to calculating expected return, investors also need to consider the risk characteristics of investment assets. This helps to determine whether the portfolio’s components are properly aligned with the investor’s risk tolerance and investment goals.
For example, assume that two portfolio components have shown the following returns, respectively, over the past five years:
Portfolio Component A: 12%, 2%, 25%, -9%, 10%
Portfolio Component B: 7%, 6%, 9%, 12%, 6%
Calculating the expected return for both portfolio components yields the same figure: an expected return of 8%. However, when each component is examined for risk, based on year-to-year deviations from the average expected returns, you find that Portfolio Component A carries five times more risk than Portfolio Component B (A has a standard deviation of 12.6%, while B’s standard deviation is only 2.6%). Standard deviation represents the level of variance that occurs from the average.
The concept of expected return is part of the overall process of evaluating a potential investment. Although market analysts have come up with straightforward mathematical formulas for calculating expected return, individual investors may consider additional factors when putting together an investment portfolio that matches up well with their personal investment goals and level of risk tolerance.
For example, an investor might consider the specific existing economic or investment climate conditions that are prevalent. During times of extreme uncertainty, investors are inclined to lean toward generally safer investments and those with lower volatility, even if the investor is ordinarily more risk-tolerant. Thus, an investor might shy away from stocks with high standard deviations from their average return, even if their calculations show the investment to offer an excellent average return.
It’s also important to keep in mind that expected return is calculated based on a stock’s past performance. However, if an investor has knowledge about a company that leads them to believe that, going forward, it will substantially outperform as compared to its historical norms, they might choose to invest in a stock that doesn’t appear all that promising based solely on expected return calculations. A helpful financial metric to consider in addition to expected return is the return on investment ratio (ROI), a profitability ratio that directly compares the value of increased profits a company has generated through capital investment in its business.
Although not a guaranteed predictor of stock performance, the expected return formula has proven to be an excellent analytical tool that helps investors forecast probable investment returns and assess portfolio risk and diversification.
Thank you for reading CFI’s guide on Expected Return. To continue learning and building your career as a financial analyst, these additional resources will be useful: