Get In-Demand Finance Certifications
LTM (Last Twelve Months)
The last twelve months (LTM) - time period in financial analysis
What is LTM (Last Twelve Months)?
LTM (Last Twelve Months), also sometimes known as the trailing or rolling twelve months, is a time frame frequently used in connection with financial ratios, such as revenues or return on equity (ROE), to evaluate a company’s performance during the immediately preceding 12-month time period. This is not necessarily related to a fiscal year period, as the LTM references any 12-month period.
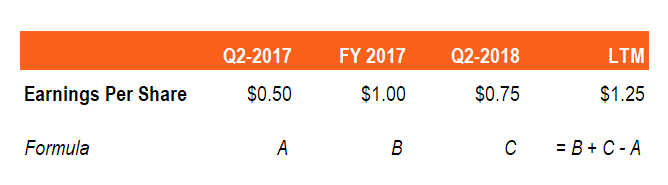
Here is an example of how to calculate the last 12 months’ Earnings per Share (EPS) halfway through a company’s fiscal year.
How to Generate the Last Twelve Month Figures from Financial Reports
In order to determine LTM figures, one uses the annual and last quarterly reports of a company. Items on the income statement for those reporting periods can be added together.
LTM figures for US-based companies can be easily calculated by using a company’s 10-K and 10-Q SEC filings.
LTM revenue = most recent quarter figures + most recent annual figures – figures in the corresponding quarter 12 months before the most recent quarter
Alternatively, if one has access to full monthly data, then one can simply utilize the collection of the last twelve months of data.
To illustrate:
A company reported quarterly revenue of $5M on 3/31/2015, $15M yearly revenue on 12/31/2015, and $8M quarterly revenue on 3/31/2016. To generate the last twelve months’ revenue figure ending 3/31/2016, the amount of revenue generated is $18M ($8M+$15M-$5M).
Why do Analysts and Investors use LTM figures?
- LTM is considered useful in assessing the most recent business performance, which is indicative of the company’s current trend;
- Its figures are more current than the fiscal or annual financial statements, which helps to avoid potentially misleading short-term measurements;
- It is useful for comparing the relative performance of similar companies within an industry or sector;
- LTM figures provide a more accurate value of a business in the event of an acquisition; and
- It gives a relevant measurement of the price-to-earnings ratio.
The LTM time frame is sufficient to provide analysts and investors with financial metrics that are not inappropriately influenced or distorted by factors such as seasonality or brief market or economic turndowns. Some of the financial ratios that are most frequently calculated on an LTM basis are earnings per share (EPS) and dividend yield.
Additional Resources
Thank you for reading CFI’s guide to LTM. Our mission is to help you advance your career, and with that goal in mind, the below resources will be useful.
Learn more about the use of the rolling twelve-month time period and financial analysis by reading the following resources from CFI:
0 search results for ‘’
People also search for:
excel
Free
free courses
accounting
ESG
Balance sheet
wacc
Explore Our Certifications
Resources
Popular Courses


Recent Searches