Get Certified for
Capital Markets (CMSA®)
From equities, fixed income to derivatives, the CMSA certification bridges the gap from where you are now to where you want to be — a world-class capital markets analyst.
A statistical indicator that measures the distribution of returns for a specific security over a specified period.
Over 1.8 million professionals use CFI to learn accounting, financial analysis, modeling and more. Start with a free account to explore 20+ always-free courses and hundreds of finance templates and cheat sheets.
Historical volatility, or HV, is a statistical indicator that measures the distribution of returns for a specific security or market index over a specified period. The historical volatility of a security or other financial instrument in a given period is estimated by finding the average deviation of the instrument from its average price.
Historical volatility is normally computed by making use of standard deviation. Securities or investment instruments that are riskier tend to show higher historical volatility.
Historical volatility is an indicator of the extent to which a price may diverge from its average in a given period. Hence, increased price fluctuation results in a higher historical volatility value. It is important to keep in mind that the historical volatility figure does not indicate the price direction but rather how unstable a price is.
Volatility is generally a measure of the riskiness of an investment. Increased volatility serves as an indication of increased uncertainty and risk. The opposite is also true; decreased volatility serves as an indication for lowered uncertainty and risk. As commonly expected in financial instrument trading, HV can be used along with other trading patterns, trends, and other indicators to identify instruments that they consider to be risky or highly volatile.
Historical volatility can be utilized as an instrument by traders who only trade underlying financial instruments. Measuring the instability of a market can impact the expectation of an investor on how much or to what extent the market may change and offers some guidance in making price forecasts and executing a trade.
A high volatility can imply a possible change of trend when aggressive buying/selling enters the market because the large transaction volumes will trigger notable price reversals.
Furthermore, historical volatility does not assess the probability of loss primarily, even though it can be used to provide an indication thereof.
HV can be used to assess by how much the price of a security shifts from its average value. In markets where a predominant trend exists, historical volatility provides an overview of the extent to which traded prices may have deviated from a central or moving average price. In smooth markets with a strong predominant trend, low volatility levels can be expected even though prices may fluctuate drastically as time passes.
The HV value does not change significantly on a daily basis, but the change occurs at a constant pace. To assess whether options may be undervalued or overvalued, the historical volatility and implied volatility are compared to one another. HV is a common measure in risk assessment and valuations.
Volatility is a measurement of the frequency of financial asset price variations over time. This shows the potential risk levels associated with the price fluctuations of a security. The volatility of an asset is measured by investors and traders to analyze historical price fluctuations and forecast their possible movements.
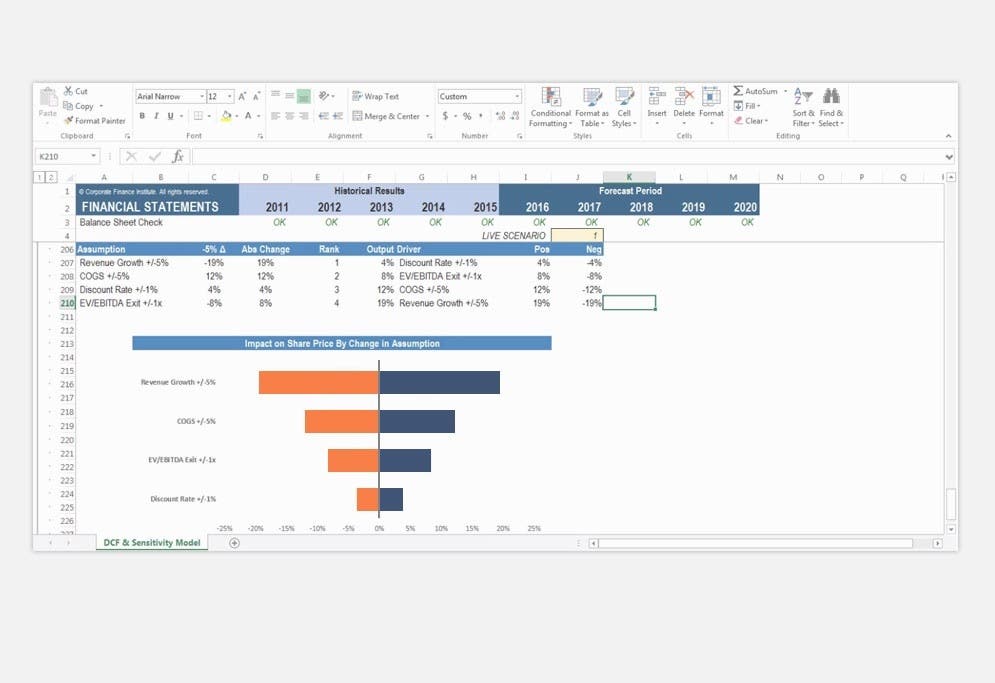
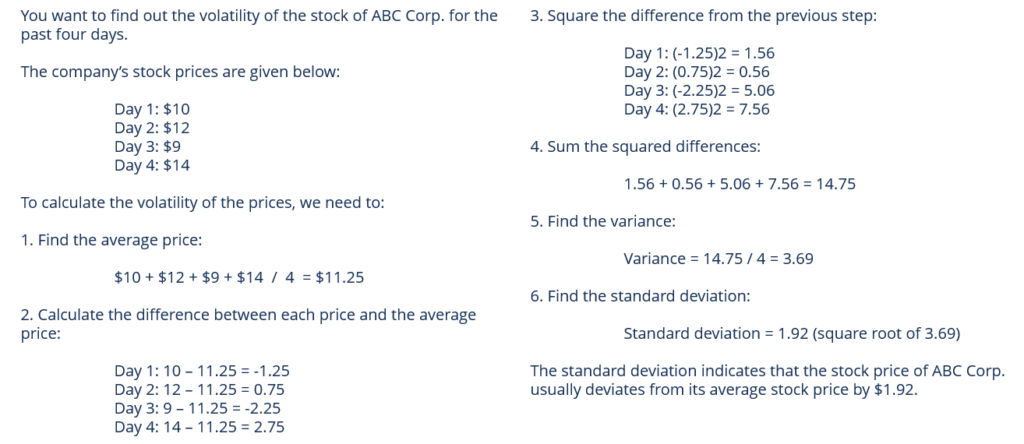
The following steps can be followed when calculating volatility through determining the standard deviation over time:
The image below illustrates an example of a volatility computation:
Implied volatility refers to the volatility of an underlying asset, which will return the theoretical value of an option equal to the option’s current market price. Implied volatility is a key parameter in option pricing. It provides a forward-looking aspect of possible future price fluctuations.
Thank you for reading CFI’s guide on Historical Volatility (HV). To keep learning and developing your knowledge base, please explore the additional relevant resources below: