Get Certified for Financial Modeling (FMVA)®
Gain in-demand industry knowledge and hands-on practice that will help you stand out from the competition and become a world-class financial analyst.
A ratio that measures how efficiently a company uses its assets to generate sales
The asset turnover ratio, also known as the total asset turnover ratio, measures the efficiency with which a company uses its assets to produce sales. The asset turnover ratio formula is equal to net sales divided by the total or average assets of a company. A company with a high asset turnover ratio operates more efficiently as compared to competitors with a lower ratio.
The formula for the asset turnover ratio is as follows:

Where:
Company A reported beginning total assets of $199,500 and ending total assets of $199,203. Over the same period, the company generated sales of $325,300 with sales returns of $15,000.
The asset turnover ratio for Company A is calculated as follows:

Therefore, for every dollar in total assets, Company A generated $1.5565 in sales.
Consider four hypothetical companies: Company A, Company B, Company C, and Company D. Companies A and B operate in the fast-food industry, while companies C and D operate in the telecommunications industry:
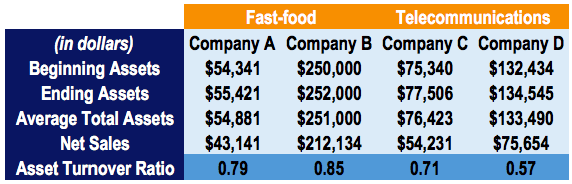
The asset turnover ratio for each company is calculated as net sales divided by average total assets.
Ratio comparisons across markedly different industries do not provide a good insight into how well a company is doing. For example, it would be incorrect to compare the ratios of Company A to that of Company C, as they operate in different industries.
It is only appropriate to compare the asset turnover ratio of companies operating in the same industry. We can see that Company B operates more efficiently than Company A. This may indicate that Company A is experiencing poor sales or that its fixed assets are not being utilized to their full capacity.
The asset turnover ratio measures the efficiency of how well a company uses assets to produce sales.
Watch this short video to quickly understand the definition, formula, and application of this financial metric.
The operating asset turnover ratio, an efficiency ratio, is a variation of the total asset turnover ratio and identifies how well a company is using its operating assets to generate revenue.
Operating assets are assets that are essential to the day-to-day operations of a business. In other words, operating assets are the assets utilized in the ordinary income-generation process of a business.

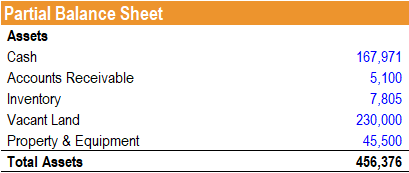
Jeff is an equity analyst and is looking to determine the efficiency of a company’s use of its assets. A partial balance sheet of the company is provided as follows:
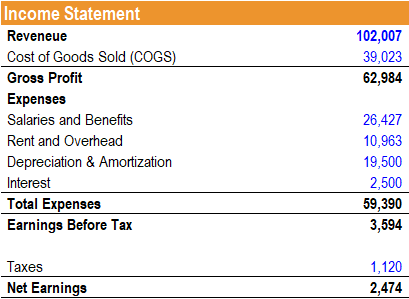
Additionally, the income statement of the company is provided as follows:
Jeff notes that the company’s balance sheet includes a line item for vacant land at $230,000. He decides to use a variation of the total asset turnover – the operating asset turnover to account for the vacant land that is not currently used in the company’s operations. He calculates the ratio as follows:
Operating Asset Turnover Ratio = (167,971 + 5,100 + 7,805 + 45,500) / 102,007 = 2.22
Therefore, for every dollar invested in its operating assets, $2.22 of revenue is generated.
The operating asset turnover ratio indicates how efficiently a company is using its operating assets to generate revenue.
The asset turnover ratio measures how efficiently a company uses its assets to generate sales, calculated as net sales divided by total or average assets.
A higher ratio indicates better efficiency, while a lower ratio suggests poor use of assets, possibly due to underutilized fixed assets, weak collections, or poor inventory management. Comparisons should only be made within the same industry, as capital intensity varies widely.
A variation, the operating asset turnover ratio, focuses only on operating assets, or assets directly involved in daily operations, by excluding non-operating items like vacant land. It provides a clearer measure of revenue generation efficiency. A higher ratio reflects stronger performance, but again, it should only be compared against industry peers.
Both ratios highlight how well a company utilizes resources to drive sales.
Connect what you just learned to a clear career path with CFI’s role‑based courses and certification programs.


