Get Certified for Financial Modeling (FMVA)®
Gain in-demand industry knowledge and hands-on practice that will help you stand out from the competition and become a world-class financial analyst.
How efficiently a business uses fixed assets to generate sales
Fixed Asset Turnover (FAT) is an efficiency ratio that indicates how well or efficiently a business uses fixed assets to generate sales. This ratio divides net sales by net fixed assets, calculated over an annual period.
The net fixed assets include the amount of property, plant, and equipment, less the accumulated depreciation. Generally, a higher fixed asset ratio implies more effective utilization of investments in fixed assets to generate revenue. This ratio is often analyzed alongside leverage and profitability ratios.
Learn more ratios in CFI’s financial analysis fundamentals course!
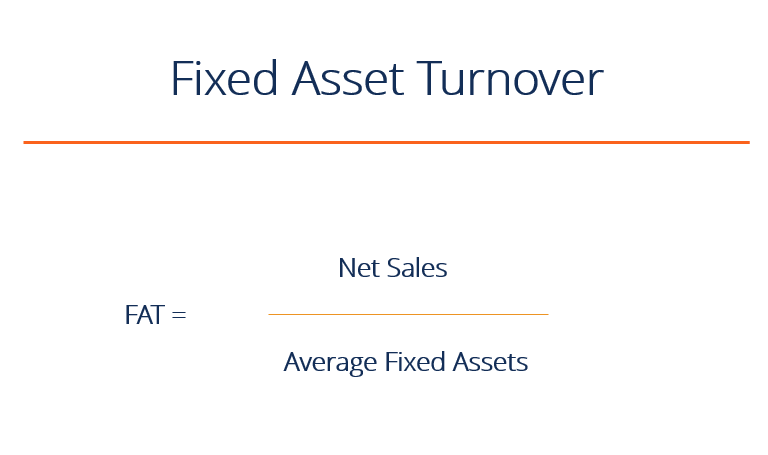
To determine the Fixed Asset Turnover ratio, the following formula is used:
Fixed Asset Turnover = Net Sales / Average Fixed Assets
Fisher Company has annual gross sales of $10M in the year 2015, with sales returns and allowances of $10,000. Its net fixed assets’ beginning balance was $1M, while the year-end balance amounts to $1.1M.
Based on the given figures, the fixed asset turnover ratio for the year is 9.51, meaning that for every dollar invested in fixed assets, a return of almost ten dollars is earned. The average net fixed asset figure is calculated by adding the beginning and ending balances and then dividing that number by 2.
Complete the form below to download our free Fixed Asset Turnover template!
* By submitting your email address, you consent to receive email messages (including discounts and newsletters) regarding Corporate Finance Institute and its products and services and other matters (including the products and services of Corporate Finance Institute's affiliates and other organizations). You may withdraw your consent at any time.
This request for consent is made by Corporate Finance Institute, #1392 - 1771 Robson Street, Vancouver, BC V6G 3B7, Canada. www.corporatefinanceinstitute.com. [email protected]. Please click here to view CFI`s privacy policy.
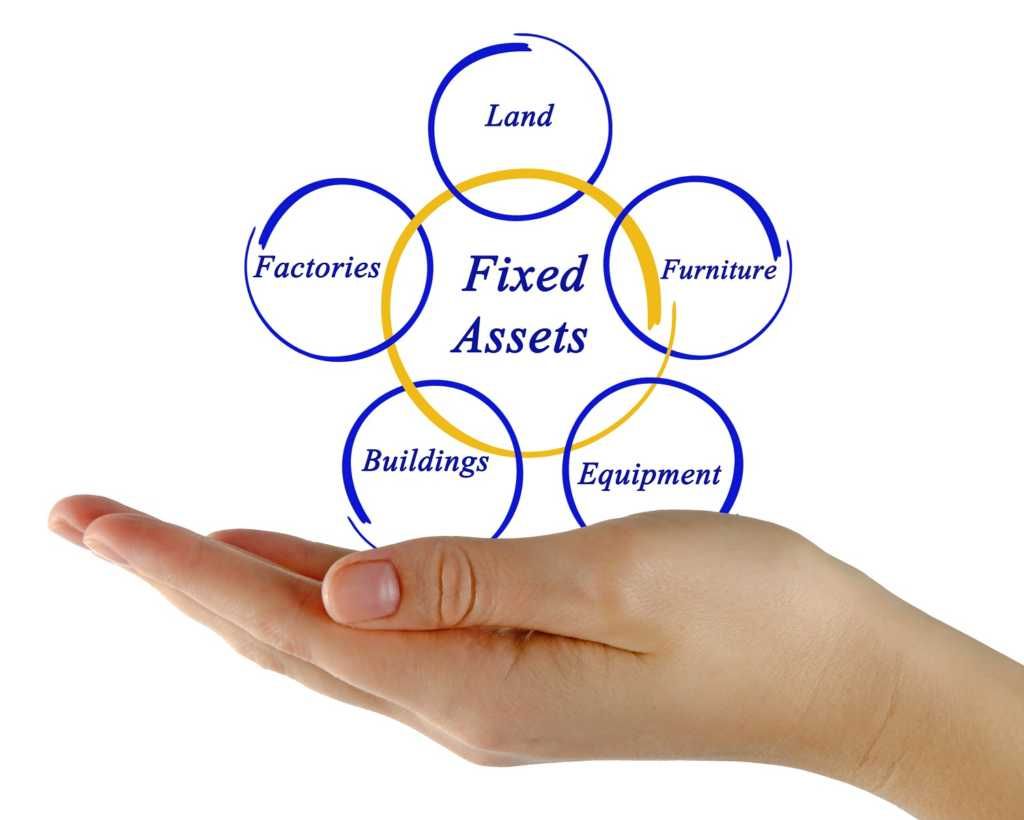
Fixed assets are tangible long-term or non-current assets used in the course of business to aid in generating revenue. These include real properties, such as land and buildings, machinery and equipment, furniture and fixtures, and vehicles.
They are subject to periodic depreciation, impairments, and disposition. All of these are depreciated from the initial asset value periodically until they reach the end of their usefulness or are retired.
When the business is underperforming in sales and has a relatively high amount of investment in fixed assets, the FAT ratio may be low.
This is especially true for manufacturing businesses that utilize big machines and facilities. Although not all low ratios are bad, if the company just made some new large purchases of fixed assets for modernization, the low FAT may have a negative connotation.
A declining ratio may also suggest that the company is over-investing in its fixed assets.
A high ratio, on the other hand, is preferred for most businesses. It indicates that there is greater efficiency in regards to managing fixed assets; therefore, it gives higher returns on asset investments.
There is no exact ratio or range to determine whether or not a company is efficient at generating revenue on such assets. This can only be discovered if a comparison is made between a company’s most recent ratio and previous periods or ratios of other similar businesses or industry standards.
Fixed assets vary significantly from one company to another and from one industry to another, so it is relevant to compare ratios of similar types of businesses.
Learn more ratios in CFI’s financial analysis fundamentals course!
Investors who are looking for investment opportunities in an industry with capital-intensive businesses may find FAT useful in evaluating and measuring the return on money invested.
This evaluation helps them make critical decisions about whether to continue investing, and it also determines how well a particular business is being managed. It is likewise useful in analyzing a company’s growth to see if they are augmenting sales in proportion to their asset bases.
Thank you for reading CFI’s guide to Fixed Asset Turnover. To learn more about assets and financial analysis, see the following CFI resources: