Get Certified for
Capital Markets (CMSA®)
From equities and fixed income to derivatives, the CMSA certification bridges the gap from where you are now to where you want to be — a world-class capital markets analyst.
A measure of the aggregate price level in an economy
The Consumer Price Index (CPI) is a measure of the aggregate price level in an economy. The CPI consists of a bundle of commonly purchased goods and services. The CPI measures the changes in the purchasing power of a country’s currency, and the price level of a basket of goods and services.
The market basket used to compute the Consumer Price Index is representative of the consumption expenditure within the economy and is the weighted average of the prices of goods and services.
The Consumer Price Index expresses the change in the current prices of the market basket of goods in a period compared to a base period. The CPI is usually computed monthly or quarterly. It is based on a representative expenditure pattern of urban residents and includes people of all ages.
Most CPI index series use 1982-84 as the basis for comparison. The U.S. Bureau of Labor Statistics (BLS) set the index level during the 1982-84 period at 100. An index of 110 means that there’s been a 10% rise in the price of the market basket compared to the reference period. Similarly, an index of 90 indicates a 10% decrease in the price of the market basket compared to the reference period.
The BLS records around 80,000 items each month by contacting retailers, service establishments, rental spaces, and service providers across the country.
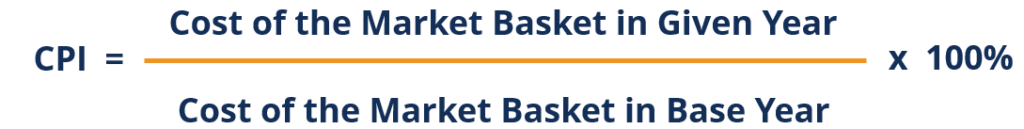
Based on the BLS survey, the CPI is calculated using the following formula:
The market basket is developed using detailed expenditure information. Governments spend considerable resources (money and time) to accurately measure expenditure information. Information sources include surveys targeted at individuals, households, and businesses.
A particular item enters the basket through the initiation process. Consider the following example that describes the initiation process for bread. A particular type of bread is chosen with a probability directly proportional to its sales figures. There are three types of breads: A, B, and C. A makes up 70% of the bread market, B makes up 20% of the bread market, and C makes up 10% of the bread market.
Therefore, the probability of bread A being chosen as the representative bread is 70%. After a representative bread is chosen, its price is monitored for the next four years, after which a new representative bread will be chosen. This bread will continue to be priced each month in the same store.
Thank you for reading CFI’s guide to the Consumer Price Index. To keep advancing your career, the additional CFI resources below will be useful: