CHOOSE Function
Returns a value from an array corresponding to the index number provided
What is the CHOOSE Function?
The CHOOSE Function[1] is categorized under Excel Lookup and Reference functions. It will return a value from an array corresponding to the index number provided. The function will return the nth entry in a given list.
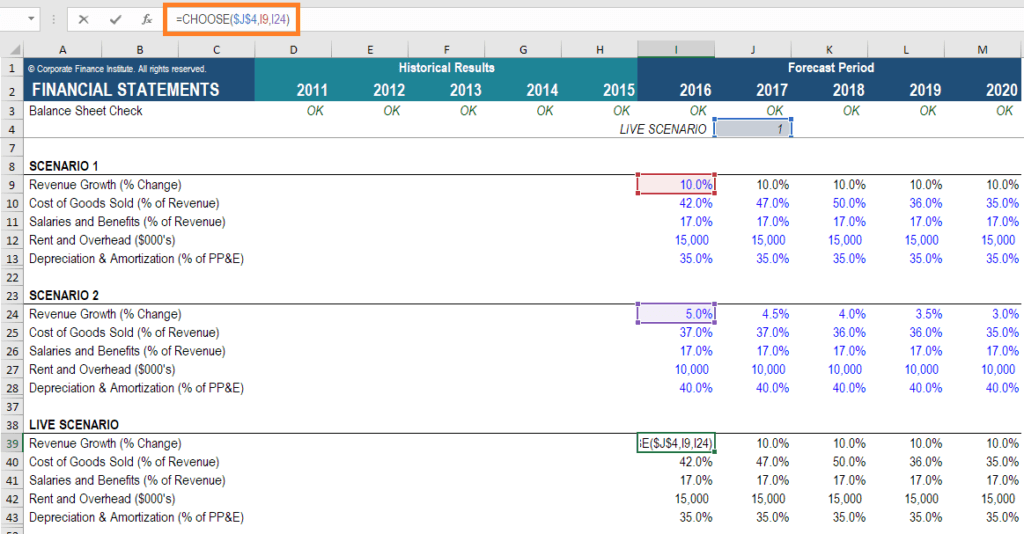
As a financial analyst, the CHOOSE function is very useful when creating scenarios in financial models. By using the CHOOSE formula, an analyst is able to select between 5 different scenarios (for example) that can flow through the entire model. Scenario analysis is an important part of building a robust financial model.
Learn more, in CFI’s scenario and sensitivity analysis course.
Formula
=CHOOSE(index_num, value1, [value2], …)
The formula uses the following arguments:
- Index_num (required argument) – This is an integer that specifies which value argument is selected. Index_num must be a number between 1 and 254, or a formula or reference to a cell containing a number between 1 and 254.
- Value1, Value2 – Value1 is a required option but the rest are optional. It is a list of one or more values that we want to return a value from.
Notes:
- If index_num is 1, CHOOSE returns value1; if it is 2, CHOOSE returns value2; and so on.
- Value1, value2 must be entered as individual values (or references to individual cells containing values).
- If the argument index_num is a fraction, it is truncated to the lowest integer before being used.
- If the argument index_num is an array, every value is evaluated when CHOOSE is evaluated.
- The value arguments can be range references, as well as single values.
How to use the CHOOSE Function in Excel?
To understand the uses of the CHOOSE function, let’s consider an example:
Example 1
Suppose we are given the following dates:
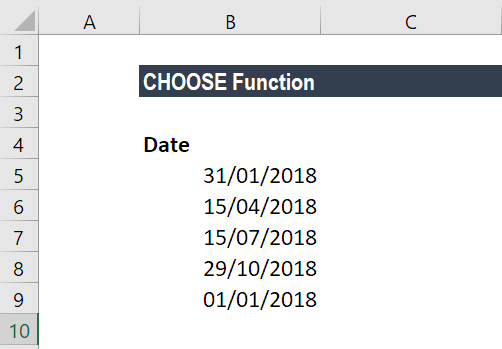
We can calculate the fiscal quarter from the dates given above. The fiscal quarters start in a month other than January.
The formula to use is:
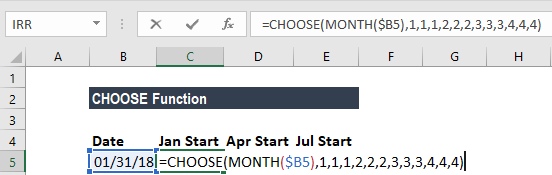
The formula returns a number from the array 1-4, which corresponds to a quarter system that begins in April and ends in March.
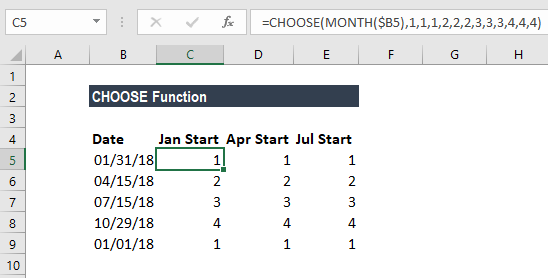
We get the results below:
A few notes about the CHOOSE Function
- VALUE! error – Occurs when:
- The given index_num is less than 1 or is greater than the given number of values.
- The given index_num argument is non-numeric.
- #NAME? error – Occurs when the value arguments are text values that are not enclosed in quotes and are not valid cell references.
Click here to download the sample Excel file
Additional Resources
Thanks for reading CFI’s guide to important Excel functions! By taking the time to learn and master these functions, you’ll significantly speed up your financial modeling and analysis. To learn more, check out these additional CFI resources:
- Excel for Finance
- Advanced Excel Formulas
- Excel Shortcuts
- Financial Analyst Program
- See all Excel resources
Article Sources
Excel Tutorial
To master the art of Excel, check out CFI’s Excel Crash Course, which teaches you how to become an Excel power user. Learn the most important formulas, functions, and shortcuts to become confident in your financial analysis.

Launch CFI’s Excel Crash Course now to take your career to the next level and move up the ladder!