SUMPRODUCT
Multiplies the components of a given array and then returns the sum of the products
What is the SUMPRODUCT Excel Function?
The SUMPRODUCT Function[1] is categorized under Excel Math and Trigonometry functions. The function will multiply the corresponding components of a given array and then return the sum of the products. It is used to calculate a weighted average.
As a financial analyst, SUMPRODUCT is a very handy function, as it can handle arrays in different ways and help in comparing data in two or more than two ranges. It also helps in calculating data with multiple criteria.
Sumproduct Formula
=SUMPRODUCT(array1,[array2],[array3],…)
The SUMPRODUCT function uses the following arguments:
- Array1 (required argument) – This is the first array or range that we wish to multiply and subsequently add.
- Array2, Array 3 (optional argument) – This is the second (or third) array or range that we wish to multiply and subsequently add.
How to use the SUMPRODUCT Excel function?
To understand the uses of the SUMPRODUCT function, let’s consider a few examples:
Example 1
Suppose we are given the following data:
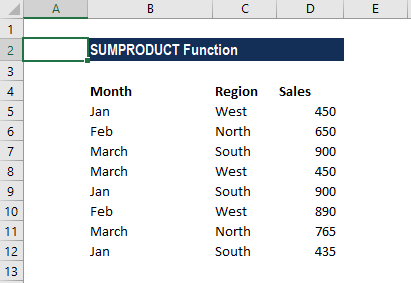
We wish to find out the total sales for the West region. The formula to be used is:
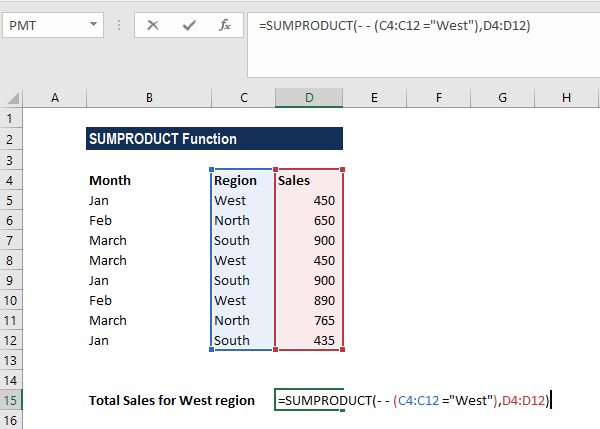
The reason we provided the double negative (- -) is to force Excel to convert the TRUE and FALSE values into 1’s and 0’s.
A virtual representation of the two arrays as first processed by SUMPRODUCT is below:
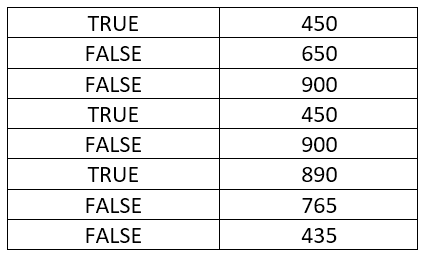
The first array contains the TRUE/FALSE values that result from the expression C4:C12=”WEST”, and the second array is the contents of D4:D12. Each item in the first array will be multiplied by the corresponding item in the second array.
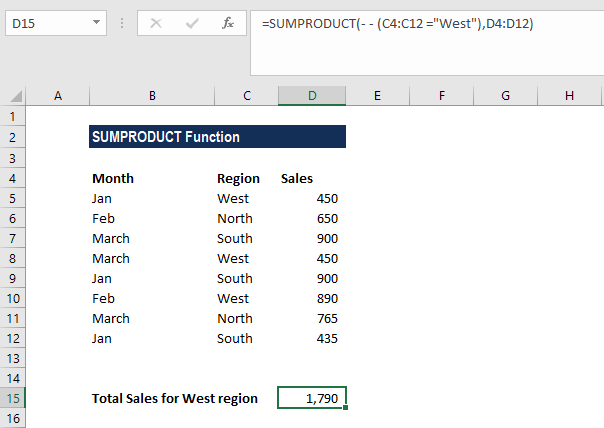
However, in the current state, the result of SUMPRODUCT will be zero, as the TRUE and FALSE values will be treated as zeroes. We need the items in array 1 to be numeric, so we need to convert them into 1’s and 0’s. This is where the double negative comes in, as it will treat TRUE as 1 and FALSE as 0.
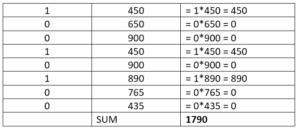
We get the result below:

Example 2: Weighted Average
One common usage of the SUMPRODUCT function is to calculate a weighted average where each value is assigned a weight. Suppose we are given the following data:
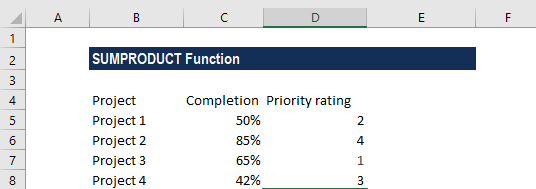
Assume the values are given in cells C2:C8 and the weights in cells D2:D8. The weighted average SUMPRODUCT formula is:
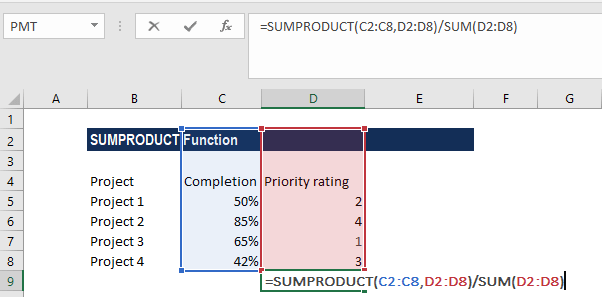
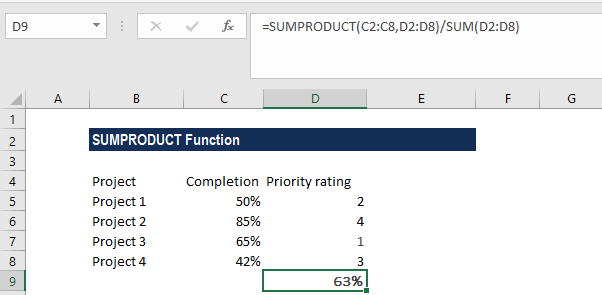
We get the result below:
Notes about the SUMPRODUCT Excel Function
- It is used to calculate a weighted average
- #VALUE error – Occurs when the arrays provided do not share the same dimensions.
- The SUMPRODUCT function will treat non-numeric entries that are part of the array as zeroes.
- SUMPRODUCT accepts up to 255 arguments in Excel 2016, Excel 2013, Excel 2010, and Excel 2007, and 30 in earlier Excel versions.
- Logical tests inside arrays will create TRUE and FALSE values. In most cases, it is advisable to convert them to 1’s and 0’s.
- SUMPRODUCT can often use the result of other functions directly. It is commonly used with LEN, or with other functions such as ISBLANK, ISTEXT, VLOOKUP, etc. A few examples are:
- Two-way lookup in Excel – SUMPRODUCT formula helps look up a value at the intersection of a given row and column.
- Count characters in Excel – Used to count the total or specific characters in a range.
- SUMPRODUCT for counting words in Excel – The function can be used to get the total number of words in a defined range or count only specific words.
- How to count distinct values – It can be used to find out how many different values appear in a range (unique plus first duplicate occurrences).
- Count duplicates and unique values – The SUMPRODUCT and COUNTIF functions help count duplicates and unique values in a column or between two columns.
- SUMPRODUCT and MONTH can be used to get a sum of values for a given month.
Click here to download the sample Excel file
Additional Resources
Thanks for reading CFI’s guide to the Excel SUMPRODUCT function. By taking the time to learn and master these Excel functions, you’ll significantly speed up your financial analysis. To learn more, check out these additional CFI resources:
- Excel Functions for Finance
- Advanced Excel Formulas Course
- Advanced Excel Formulas You Must Know
- Excel Shortcuts for PC and Mac
- See all Excel resources
Article Sources
Excel Tutorial
To master the art of Excel, check out CFI’s Excel Crash Course, which teaches you how to become an Excel power user. Learn the most important formulas, functions, and shortcuts to become confident in your financial analysis.

Launch CFI’s Excel Crash Course now to take your career to the next level and move up the ladder!