Crossover Rate Template
Crossover Rate Template
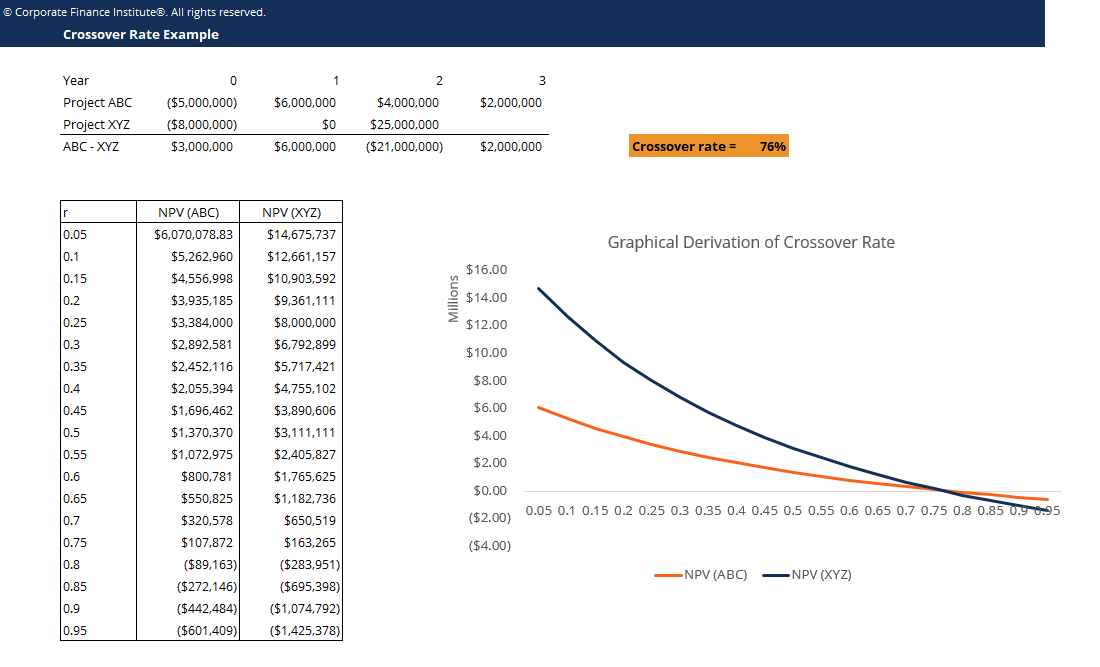
This crossover rate template will demonstrate how to calculate the NPV of different projects and plot the NPV profiles to identify the crossover rate.
This is what the crossover rate template looks like:
Download the Free Template
Enter your name and email in the form below and download the free template now!
Crossover Rate is the rate of return (alternatively called the weighted average cost of capital) at which the Net Present Value (NPV) of two projects are equal. It represents the rate of return at which the net present value profile of one project intersects the net present value profile of another project.
In capital budgeting analysis exercises, the crossover rate is used to show when one investment project becomes superior to another as a result of a change in the rate of return (cost of capital).
More Free Templates
For more resources, check out our business templates library to download numerous free Excel modeling, PowerPoint presentation, and Word document templates.
Excel Tutorial
To master the art of Excel, check out CFI’s Excel Crash Course, which teaches you how to become an Excel power user. Learn the most important formulas, functions, and shortcuts to become confident in your financial analysis.

Launch CFI’s Excel Crash Course now to take your career to the next level and move up the ladder!