Get Certified for Financial Modeling (FMVA)®
Gain in-demand industry knowledge and hands-on practice that will help you stand out from the competition and become a world-class financial analyst.
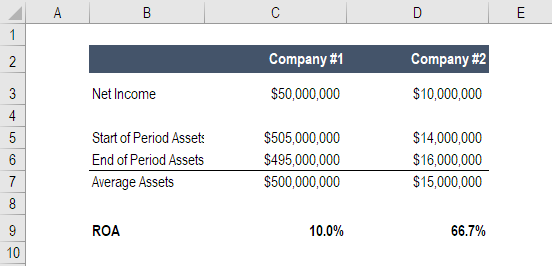
The ability of a company to generate returns on its total assets
Return on assets (ROA) is a profitability ratio that measures how efficiently a company generates profit from its total assets, calculated by dividing net income by total assets. A higher ROA indicates a company is more effective at converting its asset investments into earnings. For example, an ROA ratio of 15% means the company generates 15 cents of profit for every dollar of assets it owns.

The return on assets formula divides net income by total assets, with the result expressed as a percentage:
ROA = (Net Income / Average Total Assets) x 100
Where:
For single-period analysis, you can use ending assets:
ROA = Net Income / Ending Total Assets
Using average assets provides a more accurate measure when asset levels change significantly during the period. Many financial analysts prefer the average assets approach for year-over-year comparisons.
Suppose a business reports net income of $10 million and $50 million in total assets on the balance sheet. Follow these steps to calculate ROA:
Step 1: Identify net income = $10 million
Step 2: Identify total assets = $50 million
Step 3: Apply the formula
This company generates $0.20 in net income for every dollar of assets invested. An ROA of 20% is considered strong performance in most industries.
A good return on assets ratio depends heavily on industry characteristics, but general benchmarks include:
Capital-intensive industries naturally show lower ROAs because they require substantial investment in property, plant, and equipment to generate revenue. A utility company with an ROA of 4% may be performing well for its sector, while a technology company with the same ROA would be underperforming.
Always compare ROA against industry peers rather than across different sectors. A manufacturing company’s 6% ROA should be evaluated against other manufacturers, not against software companies achieving 25% ROAs.
Return on assets is used by investors, analysts, lenders, and management teams to evaluate business performance and make financial decisions. Each group examines ROA from a different perspective to assess operational efficiency, creditworthiness, or investment potential.
Internal management teams, especially those in asset-heavy industries, track ROA to monitor operational efficiency, set performance targets, and guide capital allocation decisions. Department heads often have ROA-linked incentives to encourage asset efficiency across the organization.
Banks and credit rating agencies examine ROA when evaluating company creditworthiness. A business that steadily generates earnings from its asset base demonstrates capacity to service debt obligations.
Equity analysts use ROA to assess management effectiveness and compare investment opportunities within the same industry. Analysts look for companies that generate strong returns relative to their asset base, which often signals competitive advantages or operational excellence.
Value investors favor ROA when evaluating asset-heavy businesses, so they can see that management generates proportional returns — not accumulating assets with no profit growth.
Private equity firms scrutinize the return on assets ratio of target companies to identify operational improvement opportunities. Low ROA relative to industry peers indicates inefficiencies that can be addressed post-acquisition. PE firms also track ROA to measure portfolio company performance after implementing operational changes.
Companies benchmark their ROA against competitors to gauge relative efficiency and identify best practices worth adopting across their own operations.
The return on assets ratio reveals how efficiently a company converts its investments into profit. ROA enables investors and managers to assess operational performance, compare companies within the same industry, and identify whether a business model is asset-intensive or asset-light.
Return on assets (ROA) measures how efficiently a company generates profit from its total assets. You can calculate return on assets using the formula: ROA = Net Income / Average Total Assets. A higher ROA indicates better asset utilization, though what constitutes a “good” ROA varies significantly by industry.
The ROA formula is: ROA = Net Income / Average Total Assets. Net income comes from the income statement, while average total assets equals the sum of beginning and ending total assets from the balance sheet divided by two. The result is expressed as a percentage to show how many cents of profit a company generates per dollar of assets.
To calculate return on assets, divide net income by average total assets, then multiply by 100 to express as a percentage. For example, if a company has net income of $10 million and average total assets of $50 million, the ROA equals 20% ($10M / $50M × 100). This means the company generates $0.20 in profit for every dollar of assets.
A good ROA depends on the industry. Asset-intensive businesses like utilities and manufacturing typically show ROAs below 5%. Companies in the 5-10% range demonstrate average performance, while 10-20% indicates strong efficiency. ROAs above 20% are excellent, commonly seen in asset-light businesses like software and consulting. Always compare ROA against industry peers rather than across different sectors.
Thanks for reading CFI’s guide to Return on Assets and the ROA Formula. To keep learning and become a world-class financial analyst, these additional CFI resources will be a big help: