Get Specialized with our Financial Planning & Analysis (FP&A) Program
Support business leaders in their decision-making with best-in-class financial models to evaluate and forecast the financial performance of a company.
The roles and responsibilities in financial planning & analysis
The role of Financial Planning and Analysis (FP&A) is gaining greater importance today, as it helps bring out crucial analysis on business performance. The role of FP&A is no longer limited to management reporting; it also requires lots of business insight so that the top management can formulate an effective strategy.
FP&A plays a critical role in business success, and qualified candidates are increasing in demand for the area. Knowledge of finance, accounting, and strategy is crucial for those who work in this department.

Typically, FP&A requires extensive data reconciliation & consolidation, as well as an understanding and interpretation of variance analysis. Additionally, coupling the use of scenario and sensitivity analysis to forecast possible outcomes facilitates using this information to create key metrics for monitoring. FP&A is not only in charge of analyzing the income statement but it is also responsible for forecasting the company’s bottom line (net income). Most importantly, it can be said that FP&A continues and enhances the work produced by the accounting team.
A key FP&A function is transforming the overarching company strategy into a long-range plan with annual operating and capital budgets. With the use of financial modeling, it forecasts operating and profitability performance and sets annual targets fork performance indicators (KPIs). By providing an annual budget, it provides management with a clear picture of future performance while giving employees a direction to work towards.
To learn the required skills for Financial Planning and Analysis, check out CFI’s FP&A courses.
Below are some examples to give a better understanding of how to analyze data and derive business insights:

The above common size analysis illustrates the breakdown of expenses on the income statement. In Year 3, we can see where expenses were favorable (blue-shaded cells) and unfavorable (orange-shaded cell). By identifying favorable and unfavorable results, an FP&A professional can investigate and identify the underlying root causes and make recommendations as necessary.
| Vendor Name | Spending (USD million) | Percentage | |
|---|---|---|---|
| 1 | KPMG | 15.4 | 50% |
| 2 | EY | 5.1 | 17% |
| 3 | ANZ Consulting | 3.1 | 10% |
| 4 | DBS Synergy Ltd | 2.4 | 8% |
| 5 | Others | 4.7 | 15% |
| TOTAL | 30.7 | 100% |
The above table shows the company’s spending on several consulting projects during the year. From the information provided, KPMG got 50% of the company’s business, which highlights the fact that it is highly dependent on KPMG, or KPMG’s charges are significantly higher compared to other firms.
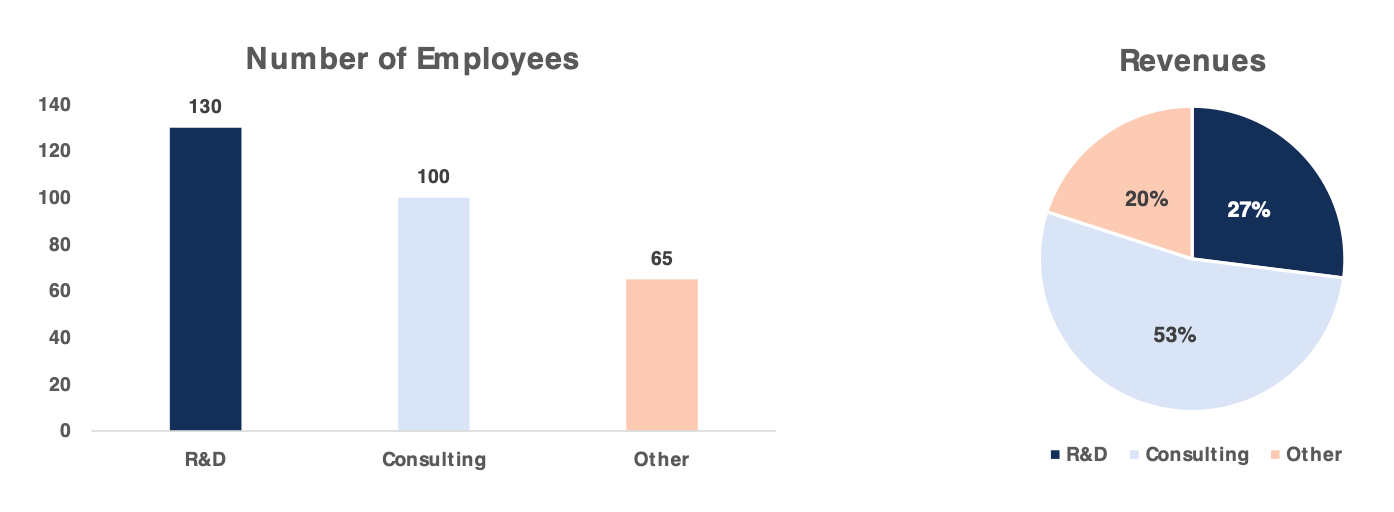
The above graph shows the employee profile in a technology company. Here, the maximum number of employees can be found in the R&D division, which is around 44% of the company’s workforce. However, if you look at the revenue from products created by the R&D division (right graph), it shows that R&D projects contribute only 27% of overall revenue. Further analysis needs to be done to find out the reasons for the discrepancy. One of the reasons can be that R&D is overstaffed or is not creating many successful projects for the company.