Common Size Analysis

A financial analysis tool that expresses each line item as a percentage of the base amount for a given period

Over 2 million + professionals use CFI to learn accounting, financial analysis, modeling and more. Unlock the essentials of corporate finance with our free resources and get an exclusive sneak peek at the first module of each course. Start Free

What is Common Size Analysis?

Common size analysis, also referred to as vertical analysis, is a tool that financial managers use to analyze financial statements. It evaluates financial statements by expressing each line item as a percentage of a base amount for that period. The analysis helps to understand the impact of each item in the financial statements and its contribution to the resulting figure.

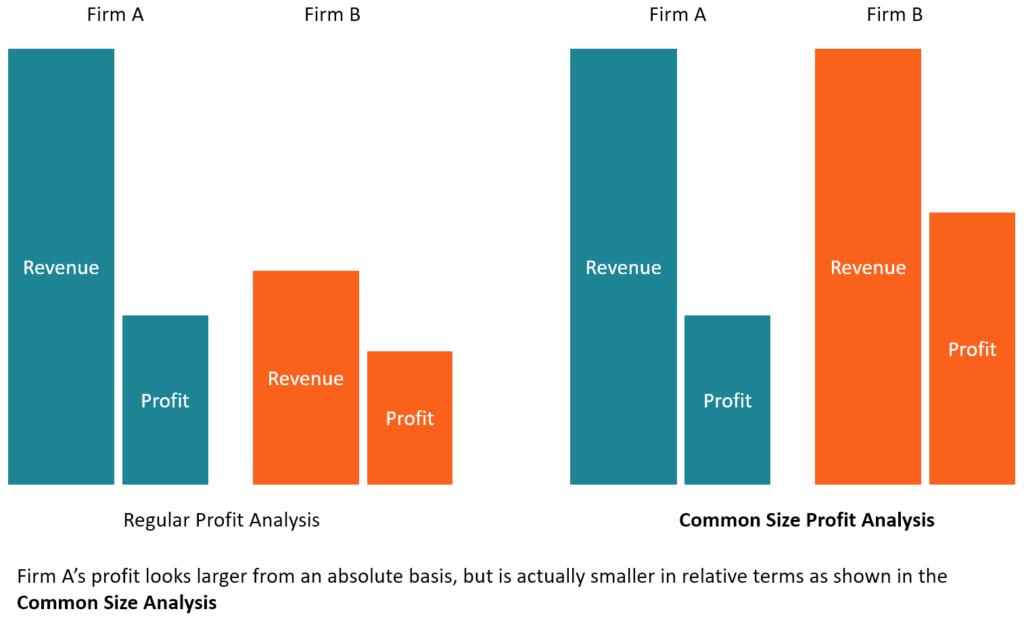
Common Size Analysis - Example of Regular Profit Analysis vs Common Size Analysis

The technique can be used to analyze the three primary financial statements, i.e., balance sheet, income statement, and cash flow statement. In the balance sheet, the common base item to which other line items are expressed is total assets, while in the income statement, it is total revenues.

Summary

  • Common size analysis evaluates financial statements by expressing each line item as a percentage of a base amount for that period.
  • The formula for common size analysis is the amount of the line item divided by the amount of the base item. For example, cost of goods sold (line item) divided by revenue (base item).
  • Benefits of common size analysis is that it allows investors to identify large changes in a company’s financial statements, as well as the ability to compare companies of different sizes.

Formula for Common Size Analysis

Common size financial statement analysis is computed using the following formula:

Common Size Analysis Formula

Types of Common Size Analysis

Common size analysis can be conducted in two ways, i.e., vertical analysis and horizontal analysis. Vertical analysis refers to the analysis of specific line items in relation to a base item within the same financial period. For example, in the balance sheet, we can assess the proportion of inventory by dividing the inventory line using total assets as the base item.

On the other hand, horizontal analysis refers to the analysis of specific line items and comparing them to a similar line item in the previous or subsequent financial period. Although common size analysis is not as detailed as trend analysis using ratios, it does provide a simple way for financial managers to analyze financial statements.

Balance Sheet Common Size Analysis

The balance sheet common size analysis mostly uses the total assets value as the base value. A financial manager or investor can use the common size analysis to see how a firm’s capital structure compares to rivals. They can make important observations by analyzing specific line items in relation to the total assets.

For example, if the value of long-term debt in relation to the total assets value is high, it may signal that the company may become distressed.

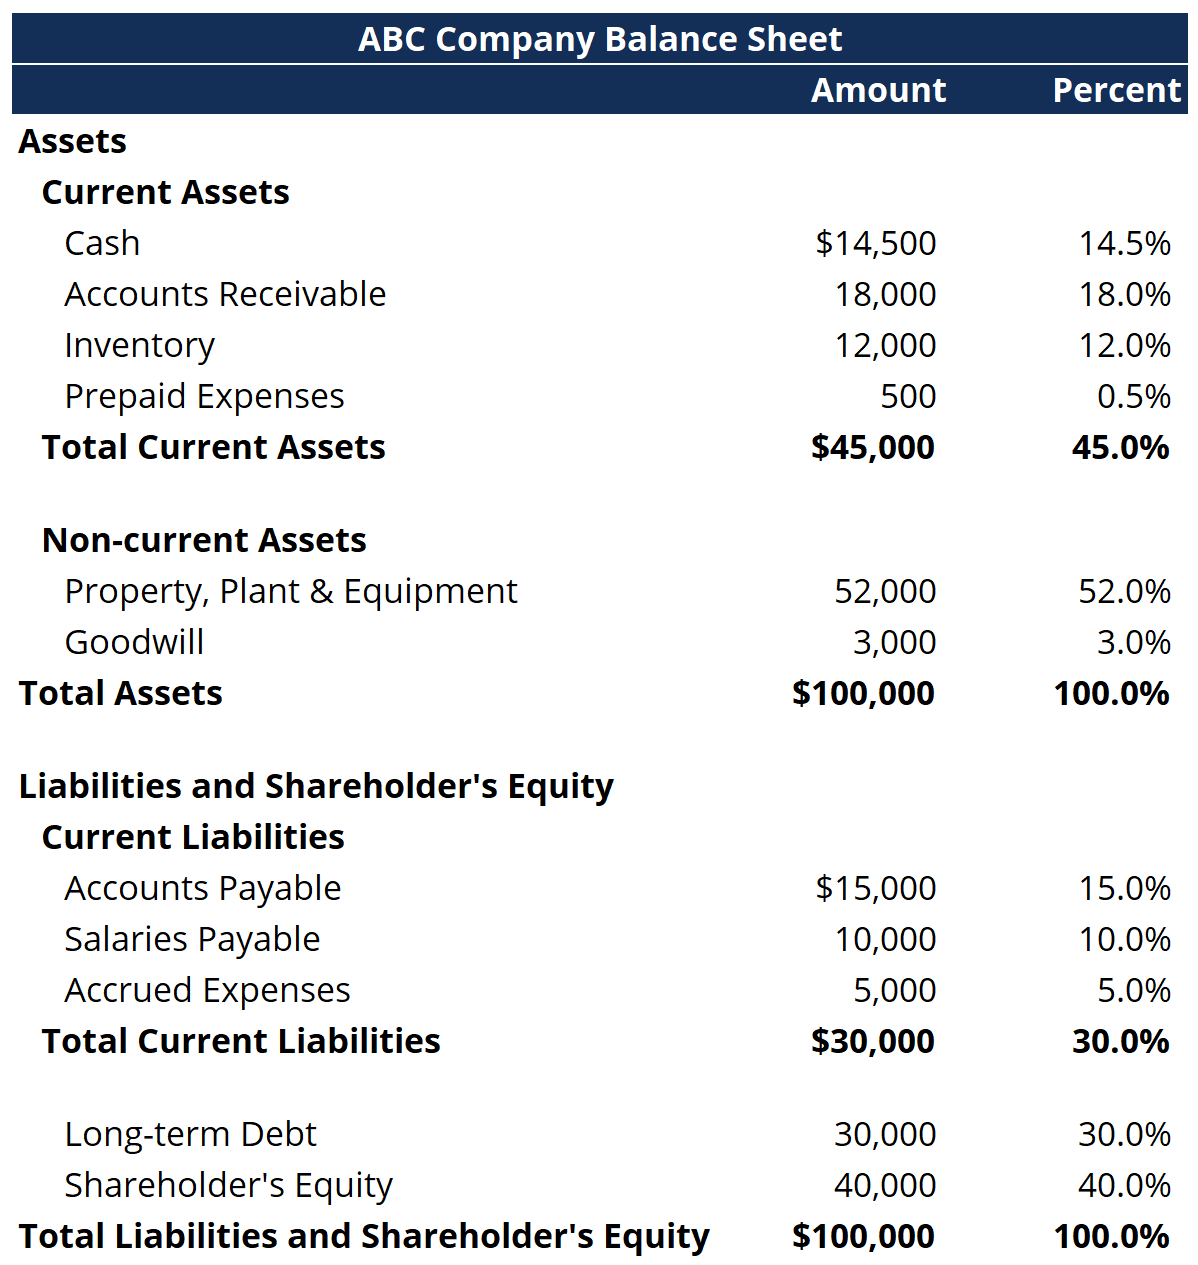
Let’s take the example of ABC Company, with the following balance sheet:

Balance Sheet Common Size Analysis


From the table above, we calculate that cash represents 14.5% of total assets while inventory represents 12%. In the liabilities section, accounts payable is 15% of total assets, and so on.

Income Statement Common Size Analysis

The base item in the income statement is usually the total sales or total revenues. Common size analysis is used to calculate net profit margin, as well as gross and operating margins.

The ratios tell investors and finance managers how the company is doing in terms of revenues, and can be used to make predictions of future revenues and expenses. Companies can also use this tool to analyze competitors to know the proportion of revenues that goes to advertising, research and development, and other essential expenses.

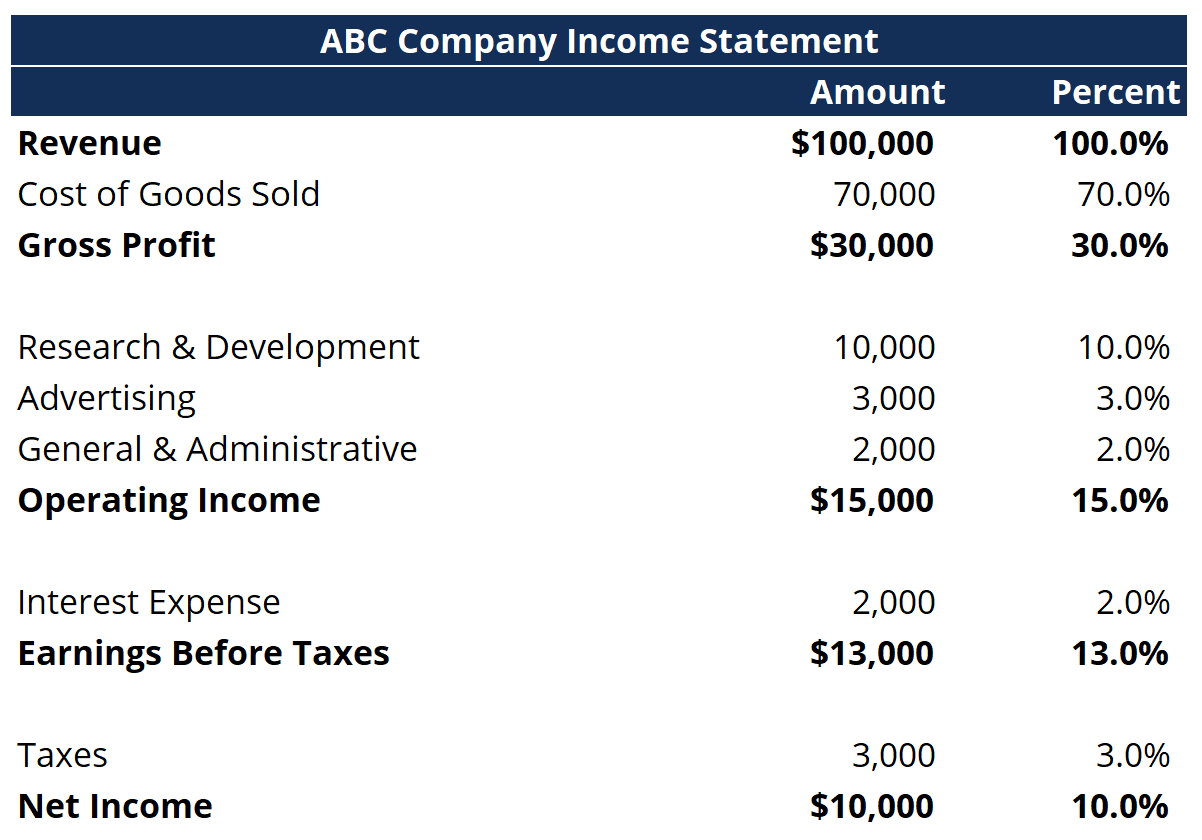
We can also analyze ABC Company’s income statement:

Income Statement Common Size Analysis

By looking at this common size income statement, we can see that the company spent 10% of revenues on research and development and 3% on advertising.

Net income represents 10% of total revenues, and this margin can be compared to the previous year’s margin to see the company’s year-over-year performance.

What are the Benefits of Common Size Analysis?

One of the benefits of using common size analysis is that it allows investors to identify large changes in a company’s financial statements. It mainly applies when the financials are compared over a period of two or three years. Any significant movements in the financials across several years can help investors decide whether to invest in the company.

For example, large drops in the company’s profits in two or more consecutive years may indicate that the company is going through financial distress. Similarly, considerable increases in the value of assets may mean that the company is implementing an expansion or acquisition strategy, potentially making the company attractive to investors.

Common size analysis is also an excellent tool to compare companies of different sizes but in the same industry. Looking at their financial data can reveal their strategy and their largest expenses that give them a competitive edge over other comparable companies.

For example, some companies may sacrifice margins to gain a large market share, which increases revenues at the expense of profit margin. Such a strategy may allow the company to grow faster than comparable companies.

When comparing any two common size ratios, it is important to make sure that they are computed by using the same base figure. Failure to do so will render the comparison meaningless.

Download the Free Template

Enter your name and email in the form below and download the free template now!

Thank you for reading CFI’s guide to Common Size Analysis. To keep learning, the following CFI resources will be helpful:

0 search results for ‘