Get Certified for
Business Intelligence (BIDA®)
Develop analytical superpowers by learning how to use programming and data analytics tools such as VBA, Python, Tableau, Power BI, Power Query, and more.
Learning Python opens up powerful capabilities as a finance professional, from automating Excel tasks to building sophisticated models. These core applications demonstrate how Python enhances financial analysis and decision-making.
Python is widely used in finance because it’s easy to learn, capable of handling complex, data-heavy tasks, and supported by ready-made toolkits called libraries. Libraries handle specific tasks without requiring you to write code from scratch.
Python is widely used in finance for analyzing large datasets and creating clear visualizations that help professionals spot trends and patterns.
As financial data volumes grow, Python is becoming an essential tool. Unlike Excel or BI (business intelligence) platforms, which can slow down with massive files, Python can process large datasets efficiently. Python’s integration directly into Excel has further expanded its use, making Python literacy increasingly valuable for finance professionals working with complex workbooks.
In practice, Python supports three main areas of data work:
Python is widely used in financial modeling and forecasting with one of its most important applications being time-series forecasting, which applies statistical and machine learning methods to predict future performance.
Finance teams use it to build cash flow models, forecast income statements, and evaluate valuation scenarios. One of Python’s most valuable applications in this area is time-series analysis, which uses historical data to predict future outcomes.
Python offers several approaches:
By applying these methods, Python enables finance professionals to build forecasts that are more accurate, adaptable, and data-driven.
Python is widely used in risk management to measure exposure, model different types of risk, and automate monitoring processes.
Python enables the calculation of portfolio risk metrics such as expected return, standard deviation, and covariance matrices. These tools help analysts understand asset correlations, diversification benefits, and overall portfolio exposure.
Python can automate tasks such as gathering risk data, executing models, and backtesting them against historical data. This allows finance teams to evaluate how risk models perform under different market conditions.
Through these applications, Python gives risk analysts a versatile toolkit for quantifying exposures, identifying potential problems early, and testing strategies before putting them into practice.
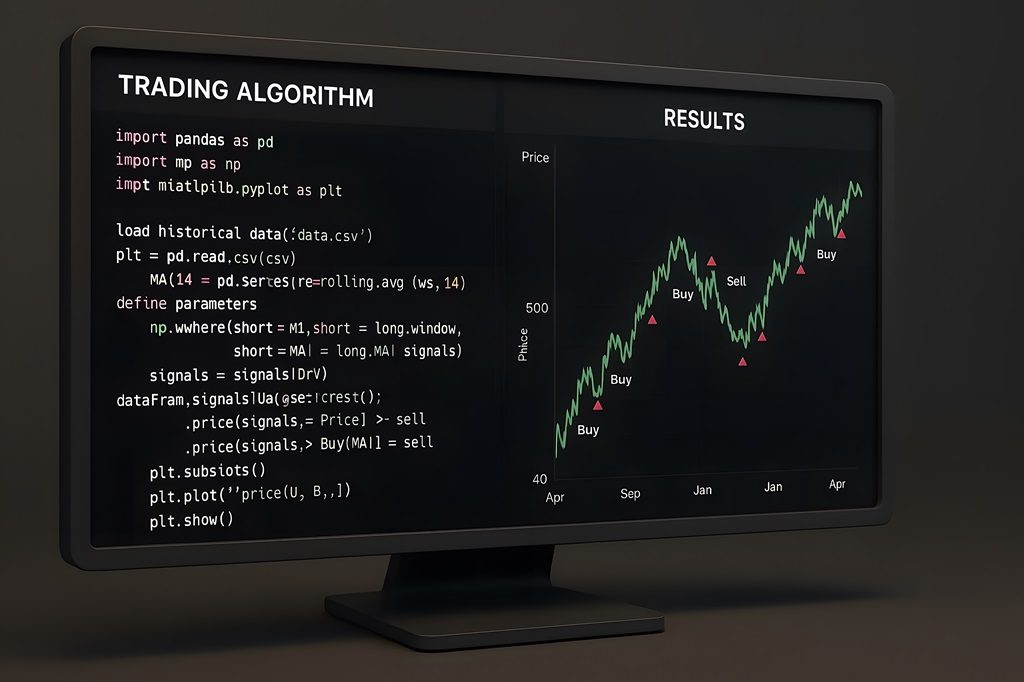
Python is widely used in algorithmic trading to design strategies, test them against historical data, and automate trade execution.
Finance teams use Python to create trading strategies based on price patterns, statistical relationships, or predictive models. These strategies can be tested against historical market data to see how they would have performed before being deployed in real markets.
Python can connect directly to sources of market data, both real-time and historical. This allows analysts to monitor price movements, generate trading signals, and update strategies without manual downloads or data entry.
Python links with trading platforms so that trades can be placed automatically when certain conditions are met. This makes it possible to run strategies continuously and react quickly to changes in the market.
Risk management rules, such as limits on trade size, stop-loss orders, or maximum portfolio exposure, can be built directly into Python trading scripts. This ensures that strategies are executed with safeguards in place.
By combining strategy design, data integration, execution, and risk controls, Python provides a complete environment for developing and managing algorithmic trading systems.
Finance professionals can get started with Python by learning the basics of programming and applying them to simple, finance-focused tasks.
A good first step is to download and install Python along with a beginner-friendly workspace, such as Jupyter Notebook. These environments let you write and run small pieces of code step by step, making it easier to test ideas and see immediate results.
From there, start with manageable projects that reflect real finance workflows, like importing a CSV of stock prices, calculating returns, or creating a simple cash flow chart. As your confidence grows, you can move into larger projects such as building forecasting models or running risk calculations.
With steady practice, Python becomes a tool you can apply across financial analysis, forecasting, and risk management, the same core applications highlighted throughout this article.
Python is now a core tool in finance, supporting everything from data analysis and forecasting to risk management and trading.
Its strength lies in handling large datasets, automating complex processes, and applying advanced methods like time-series forecasting and machine learning. By mastering these applications, finance professionals can improve accuracy, expand analytical capabilities, and deliver insights that guide better decisions.
The most useful Python libraries for finance are Pandas for data handling, NumPy for numerical calculations, Matplotlib for visualization, SciPy for statistical functions, and scikit-learn for machine learning.
Python doesn’t fully replace Excel but works alongside it by automating tasks, managing larger datasets, and running advanced calculations. Most finance teams use Python and Excel together.
Yes. Python is widely used for financial modeling because it can process complex datasets, run scenario and sensitivity tests, and refresh models automatically with new inputs.
CFI’s Python courses are designed to help finance professionals build hands-on skills in automation, modeling, analytics, and more. Whether you’re new to programming or looking to expand your toolkit, you’ll get step-by-step training that connects directly to real finance workflows.
Start learning Python with CFI today and apply it to your financial projects with confidence.
Transitioning from Excel to Python
4 Must-Know Python Libraries for Data Analysis