Get Certified for
Business Intelligence (BIDA®)
Develop analytical superpowers by learning how to use programming and data analytics tools such as VBA, Python, Tableau, Power BI, Power Query, and more.
A statistical approach of eliminating outliers from datasets to make the patterns more noticeable
Data smoothing refers to a statistical approach of eliminating outliers from datasets to make the patterns more noticeable. It is achieved using algorithms to eliminate statistical noise from datasets. The use of data smoothing can help forecast patterns, such as those seen in share prices.

During the compilation of data, it may be altered to reduce or eliminate any wide variances or other statistical noises. Data smoothing helps traders or statisticians look at a lot of data – which can be complicated to process – to find trends or patterns they would’ve otherwise overlooked.
Such an approach uses simplified improvements to forecast various patterns better. It focuses on creating a basic direction for the main data points by avoiding any volatile pieces of data and drawing a smoother curve across data points.
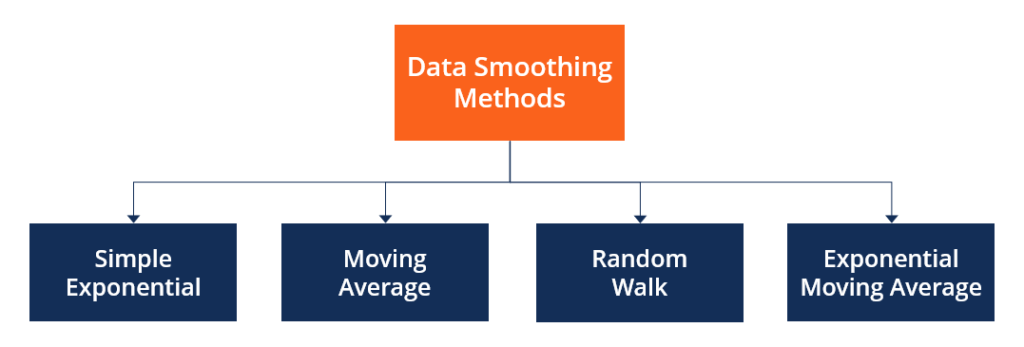
The random method, simple moving average, random walk, simple exponential, and exponential moving average are some of the methods that can be used for data smoothing. The commonly used methods are discussed below:
The simple exponential method is a popular data smoothing method because of the ease of calculation, flexibility, and good performance. It uses an average calculation for assigning the exponentially declining weights beginning with the most recent observation. The method can be easily learned and applied.
The predictions are considered accurate since the difference between the real projections and what really happens is accounted for in the simple exponential approach. However, the method is not capable of managing trends well. Hence, it is used when cyclical variations are not present.
The moving average approach is best used when there is slight or no seasonal variation. Moving average data smoothing is used for separating random variation.
It is a simple data smoothing approach that economists use to help assess the underlying patterns in building permits and other volatile datasets. Moving average consolidates the month-long data points into time units longer than a month, such as an average of data of several months.
The random walk data smoothing method is commonly used for describing the patterns in financial instruments. Some investors think that the past movement in the price of a security and the future movements cannot be related. They use the random walk method, which assumes that a random variable will give the potential data points when added to the last accessible data point.
In the exponential moving average approach, weights are applied to historical observations after using the exponential smoothing method. It focuses more on the latest data observations. Hence, the exponential moving average responds faster to price changes than the simple moving average method.
Furthermore, the predictions only need the previous volatility prediction and the previous cycle price shift. The forecast is not needed to be recalculated using a long price returns history.
Data smoothing methods are easy to understand and implement. It can help in identifying trends in businesses, financial securities, and the economy.
Data smoothing can help expose patterns in complicated data. It assists in the prediction of the usual direction of the next observed data point. If users do not need certain data points, data smoothing eliminates the data points if they are of no interest to the user.
It also helps to generate smooth graphs that depict trends and patterns.
Data smoothing does not necessarily offer an interpretation of the themes or patterns it helps to recognize. It can also contribute to certain data points being overlooked by focusing on others.
Sometimes, data smoothing may eliminate the usable data points. It may lead to incorrect forecasts if the data set is seasonal and not completely be reflective of the reality produced by the data points. Moreover, data smoothing can be prone to considerable disruption from the outliers in the data.
To keep advancing your career, the additional resources below will be useful:


