FREQUENCY Function
Calculates and returns a frequency distribution
What is the FREQUENCY Function?
The FREQUENCY Function[1] is categorized under Excel Statistical functions. The function will calculate and return a frequency distribution. We can use it to get the frequency of values in a dataset.
In financial modeling, FREQUENCY can be useful in calculating the frequency of a value within a range of values. For example, we can use the function to count the number of employees whose IQ falls within a certain range.
Formula
=FREQUENCY(data_array, bins_array)
The FREQUENCY function uses the following arguments:
- Data_arrays (It is a required argument) – This is an array or reference to a set of values for which you want to count frequencies.
- Bins_array (It is a required argument) – This is an array of intervals (“bins”) for grouping values.
Remember that:
- If data_array contains no values, FREQUENCY returns an array of zeros.
- If bins_array contains no values, FREQUENCY returns the number of elements in data_array.
To create a frequency distribution using FREQUENCY:
- We need to enter numbers that represent the bins we want to group values into.
- Make a selection the same size as the range that contains bins, or greater by one, if we want to include the extra item.
- Enter the FREQUENCY function as an array formula using Control+Shift+Enter.
How to use the FREQUENCY Function in Excel?
As a worksheet function, FREQUENCY can be entered as part of a formula in a cell of a worksheet. To understand the uses of the function, let us consider a few examples:
Example 1
Suppose we are a toy manufacturing company. We can use the FREQUENCY function to count the number of children falling into three different age ranges, which are specified by the bins_array (stored in cells B2-B3 of the spreadsheet).
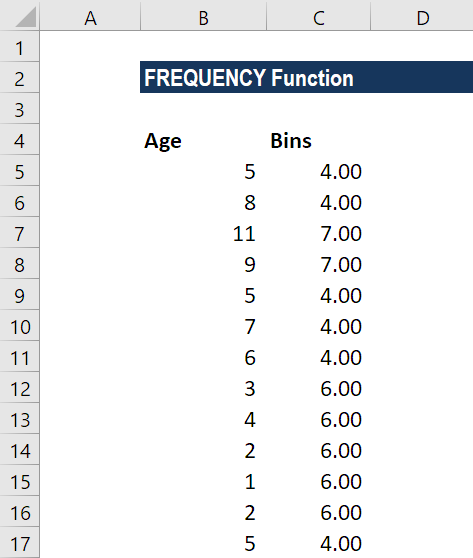
In the table above, the bins_array values specify the maximum values for the age ranges. Therefore, in this example, the ages are to be split into the ranges 0-4 years, 5-8 years and 9 years+.
We will enter the formula below:
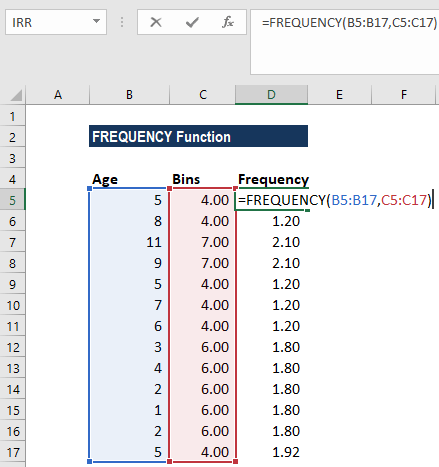
FREQUENCY would be entered as an array formula after we select a range of adjacent cells into which we want the returned distribution to appear.
We used CTRL+SHIFT+ENTER to get curly brackets for array formulas. The results we get are shown below:
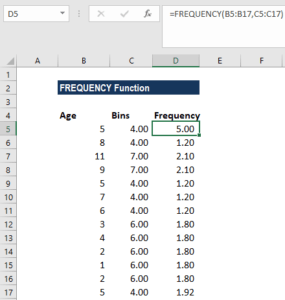
A few observations:
- FREQUENCY function will always return an array with one more item than the bins_array. This is done by design to catch any values greater than the largest interval in the bins_array.
- Each bin shows a count of values up to and including bin value, excluding values already accounted for.
Example 2
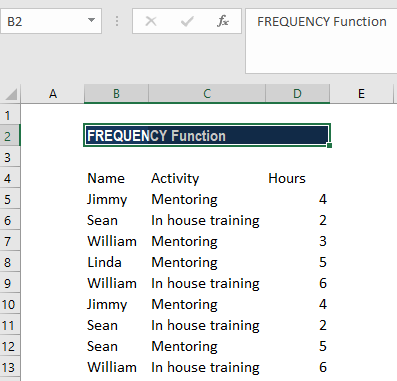
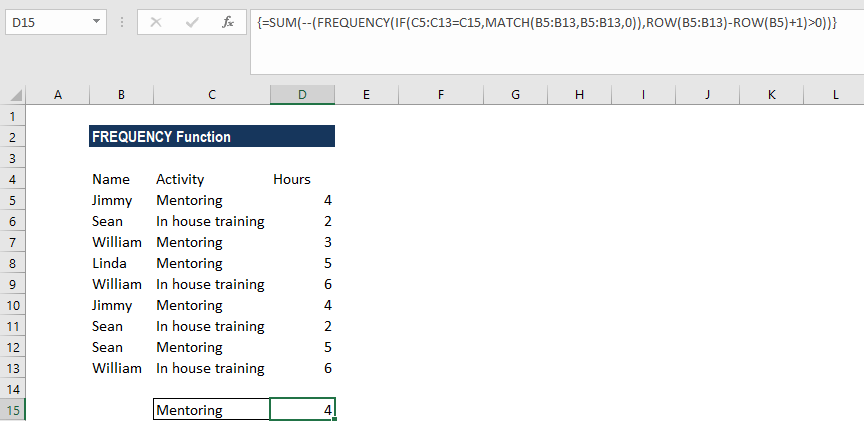
We can use the FREQUENCY function to count unique values in a range with some criteria. Suppose we are given a list of employees who participated in an activity, along with the time expended on the activity.
Looking at the data below, we can see that the same employee names appear more than once, so what we want is a count of the unique names.
The formula we will use is:
=SUM(–(FREQUENCY(IF(B2:B10=F1,MATCH(A2:A10,A2:A10,0)),ROW(A2:A10)-ROW(A2)+1)>0))-:
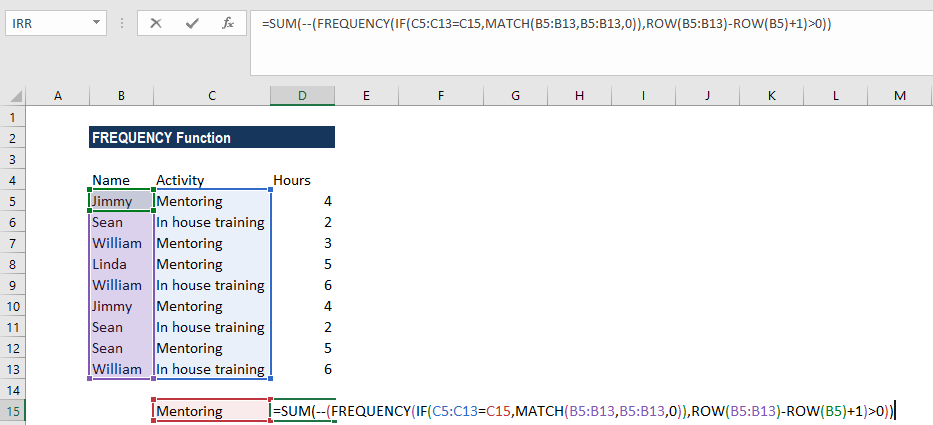
Use CTRL+SHIFT+ENTER to get curly brackets for array formulas. We will get the result below:
A few notes about the FREQUENCY function:
- The function ignores blank cells.
- #N/A error – Occurs if the array formula is entered into a range of cells that is too large, i.e., the #N/A error appears in all cells after the n’th cell (where n is the length of the bins_array + 1).
- Formulas that return arrays must be entered as array formulas.
Click here to download the sample Excel file
Additional Resources
Thanks for reading CFI’s guide to important Excel functions! By taking the time to learn and master these functions, you’ll significantly speed up your financial analysis. To learn more, check out these additional CFI resources:
- Advanced Excel Course
- Excel Formulas You Must Know
- Excel Shortcuts
- MDURATION Function
- SUM Function
- See all Excel resources
Article Sources
Excel Tutorial
To master the art of Excel, check out CFI’s Excel Crash Course, which teaches you how to become an Excel power user. Learn the most important formulas, functions, and shortcuts to become confident in your financial analysis.

Launch CFI’s Excel Crash Course now to take your career to the next level and move up the ladder!