Get Certified for Financial Modeling (FMVA)®
Gain in-demand industry knowledge and hands-on practice that will help you stand out from the competition and become a world-class financial analyst.
Past M&A transactions
Precedent transaction analysis is a method of company valuation where past M&A transactions are used to value a comparable business today. Commonly referred to as “precedents,” this method of valuation is common when trying to value an entire business as part of a merger/acquisition and is commonly prepared by analysts working in investment banking, private equity, and corporate development.
This guide will break down the various components of precedent transactions and enable you to perform the analysis on your own.
The process begins by looking for other transactions that have happened in (ideally) recent history and are in the same industry.
The screening process requires setting criteria such as:
The above criteria can be set in a financial database, such as Bloomberg or CapIQ, and exported to Excel for further analysis.
Once the initial screen has been performed and the data is transferred into Excel, then it’s time to start filtering out the transactions that don’t fit the current situation.
In order to sort and filter the transactions, an analyst has to “scrub” the transactions by carefully reading the business descriptions of the companies on the list and removing any that aren’t a close enough fit.
Many of the transactions would have missing and limited information if the deal terms were not publicly disclosed. The analyst will search high and low for a press release, equity research report, or another source that contains deal metrics. If nothing can be found, those companies will be removed from the list.
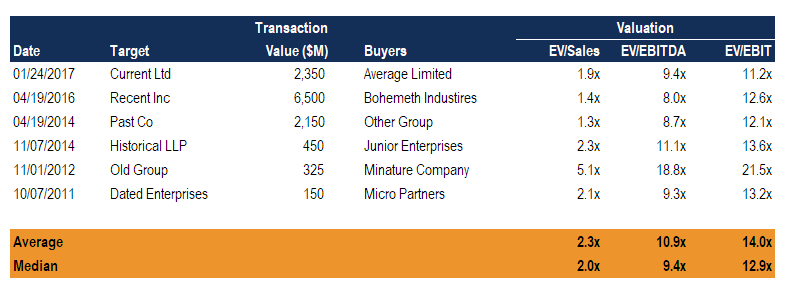
When a shortlist is prepared (following steps 1 and 2), the average, or selected range, of valuation multiples can be calculated.
The most common multiples for precedent transaction analysis are EV/EBITDA and EV/Revenue.
An analyst may exclude any extreme outliers, such as transactions that had EV/EBITDA multiples much lower or much higher than the average (assuming there is a good justification for doing so).
After a range of valuation multiples from past transactions has been determined, those ratios can be applied to the financial metrics of the company in question.
For example, if the valuation range was:
And the company in question reports an EBITDA of $150 million,
The valuation ranges for the business would be:
Once a valuation range has been determined for the business that’s being valued, it’s important to graph the results so they can be easily understood and compared to other methods.
The Football field chart is the best way to illustrate the various methods on one page in a simple way.
The main valuation methods included in the chart are:

Download a free football field template here.
Both methods are a form of relative valuation, where the company in question is being compared to other businesses to derive its value. However, “comps” are current multiples that can be observed in the public markets, while “precedents” include a takeover premium that took place in the past.
The main similarities are:
The main differences are:
Discounted Cash Flow (DCF) analysis is a form of intrinsic valuation performed by building a financial model in Excel. Unlike relative methods, it does not take into account what any other businesses are worth.
Financial modeling is a much more detailed and totally customized way to value a business. A financial forecast is made for the company by building up its revenue drivers, margins, cost structure, capital expenditures, and balance sheet items to determine its unlevered free cash flow.
To learn more, see our free financial modeling guide or our financial modeling courses.
Thank you for reading CFI’s guide to Precedent Transaction Analysis. To keep learning more and advance your career in corporate finance, these additional resources will serve you well:


