Football Field Chart Template
Downloadable Excel template
What is a Football Field Chart?
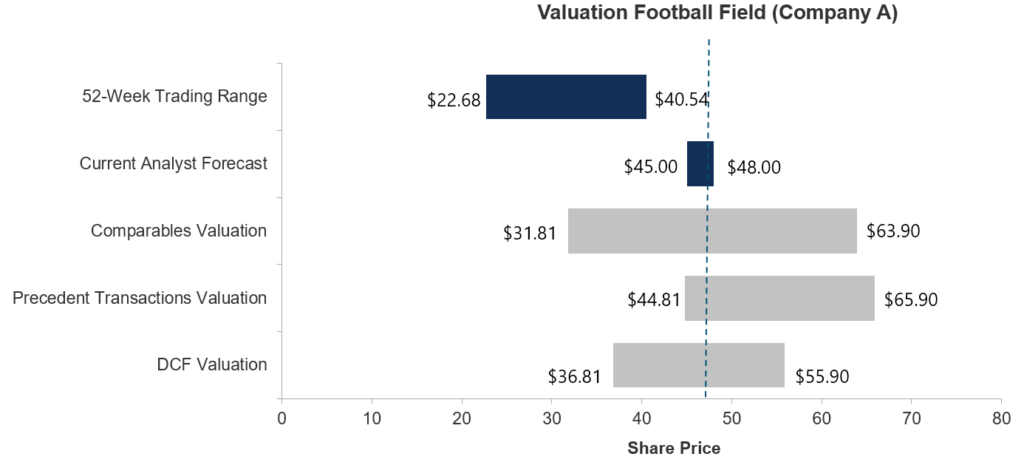
A football field chart is used to summarize a range of values for a business, based on different valuation methods. This guide includes a free Football Field Chart Template to download at the end of the page. The purpose of the chart is to show how much a buyer might be willing to pay for a business, whether acquiring all of it, part of it, or even a single share (depending on the audience).
Why Is It Called a Valuation Football Field?
The chart is called this because the bars look like yard lines on an actual football field, and hence the name. Also, the graph is commonly used in investment banking, and bankers like sports analogies.
Why Use a Football Field Chart
The reason they’re used is to visually show what the range of values for business is and see where an average, a target valuation lies compared to several alternatives. It’s common to see these charts in an investment banking pitch book or equity research report, summarizing the various valuation methods that were used.
The range of valuation methods typically includes:
- Comparable Company Analysis
- Precedent Transactions
- DCF Analysis
- Recent High and Low Share Prices
How Do You Make a Valuation Football Field Chart?
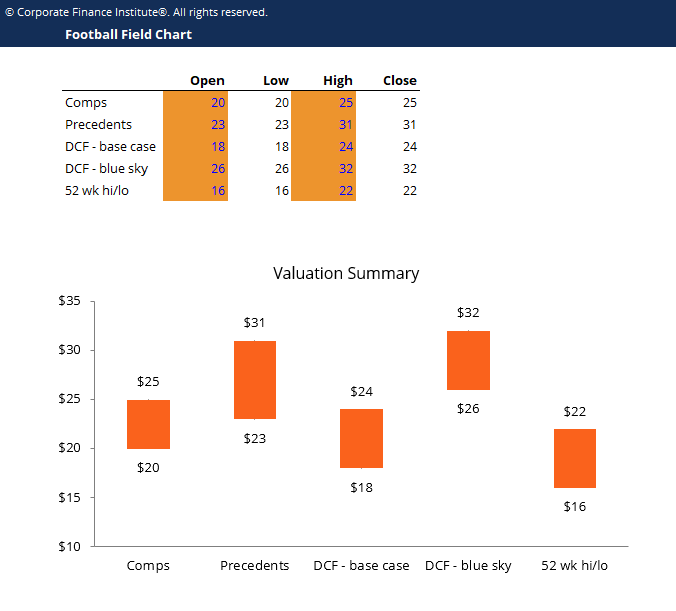
Football fields are easy to make in Excel using the stock chart option.
Here are the steps for making a football field chart in Excel:
- Create a table in Excel with the range of values
- Insert a stock chart type called Open-Low-High-Close
- Set the Open and Low values as being the same
- Set the High and Close values as being the same
Download the Free Football Field Chart Template
Valuation Football Field Chart – Excel Video Tutorial
Below is a video tutorial on how to use a stock chart in Excel to create a valuation football field chart. This is one of the lessons of our Business Valuation Modeling Course.
Connect what you just learned to a clear career path with CFI’s role‑based courses and certification programs.
Additional Resources
CFI is the official global provider of the Financial Modeling and Valuation Analyst (FMVA)™ certification, developed to transform anyone into a world-class financial analyst.
With that in mind, CFI’s vast library of resources to help you along your journey. Here are some useful things we think you will find valuable:
Excel Tutorial
To master the art of Excel, check out CFI’s Excel Crash Course, which teaches you how to become an Excel power user. Learn the most important formulas, functions, and shortcuts to become confident in your financial analysis.

Launch CFI’s Excel Crash Course now to take your career to the next level and move up the ladder!


