Get Certified for Financial Modeling (FMVA)®
Gain in-demand industry knowledge and hands-on practice that will help you stand out from the competition and become a world-class financial analyst.
Step-by-step guide
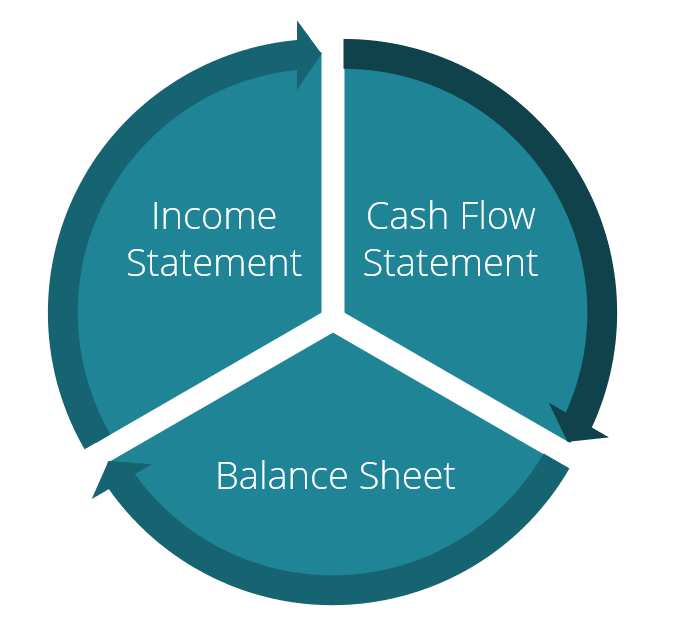
The 3 financial statements are all linked and dependent on each other. In financial modeling, your first job is to link all three statements together in Excel, so it’s critical to understand how they’re connected. This is also a common question for investment banking interviews, FP&A interviews, and equity research interviews. See CFI’s free interview guides to learn more.
In this tutorial, we will break it down for you step-by-step, although we assume you already have a basic understanding of accounting fundamentals and know how to read financial statements.
Want to see a live demonstration? Watch CFI’s free webinar on how to link the 3 financial statements in Excel.
The income statement is not prepared on a cash basis – that means accounting principles such as revenue recognition, matching, and accruals can make the income statement very different from the cash flow statement of the business. If a company prepared its income statement entirely on a cash basis (i.e., no accounts receivable, nothing capitalized, etc.) it would have no balance sheet other than shareholders’ equity and cash.
It’s the creation of the balance sheet through accounting principles that leads to the rise of the cash flow statement.
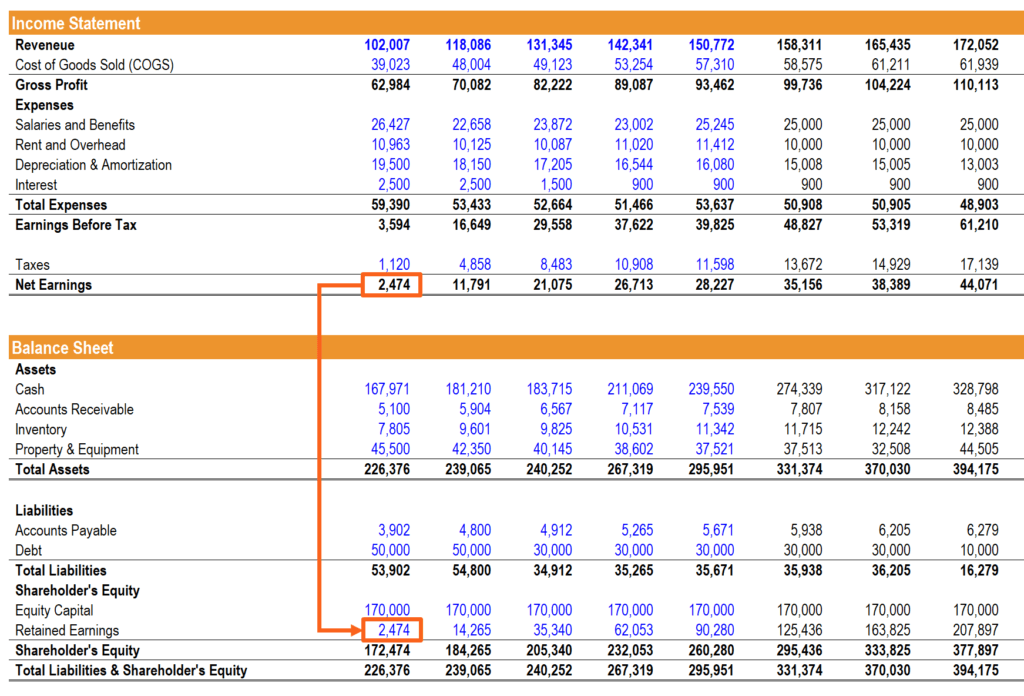
Net income from the bottom of the income statement links to the balance sheet and cash flow statement. On the balance sheet, it feeds into retained earnings and on the cash flow statement, it is the starting point for the cash from operations section.
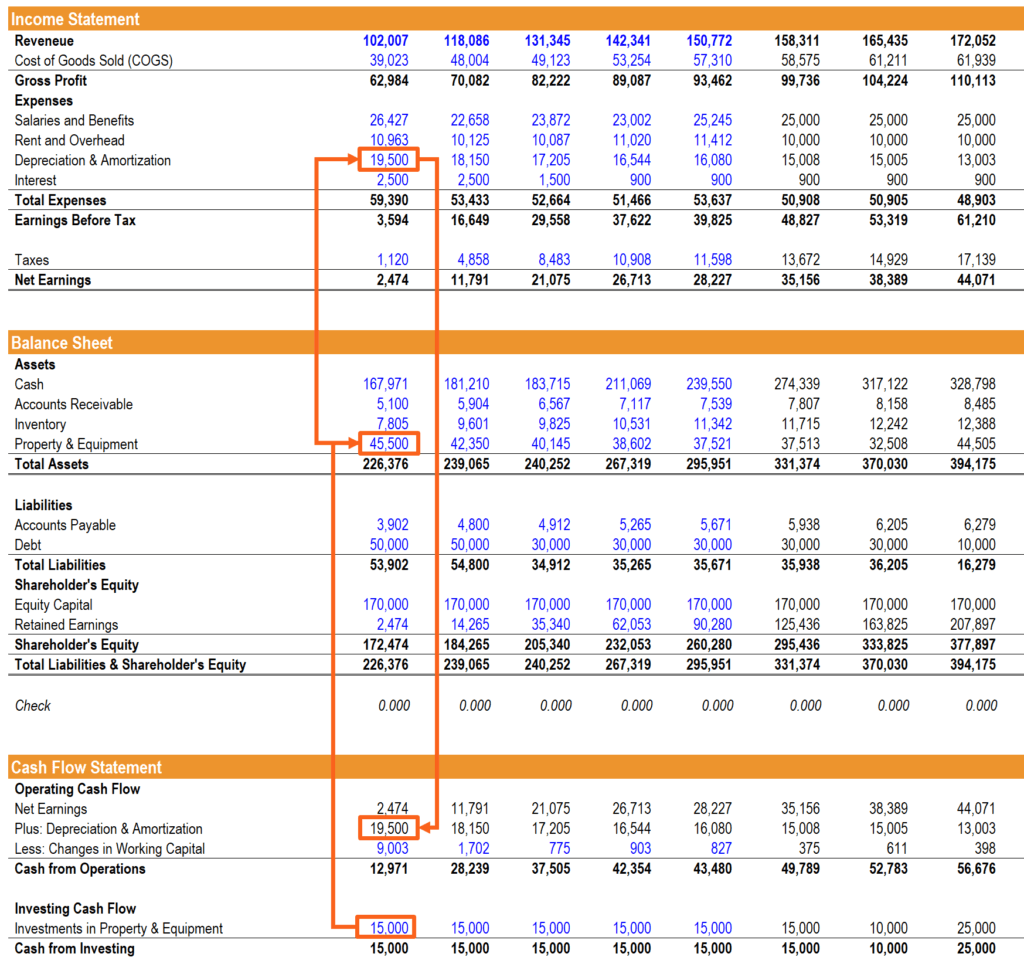
Depreciation and other capitalized expenses on the income statement need to be added back to net income to calculate the cash flow from operations. Depreciation flows out of the balance sheet from Property Plant and Equipment (PP&E) onto the income statement as an expense, and then gets added back in the cash flow statement.
For this section of linking the 3 financial statements, it’s important to build a separate depreciation schedule.
Capital expenditures add to the PP&E account on the balance sheet and flow through cash from investing on the cash flow statement.
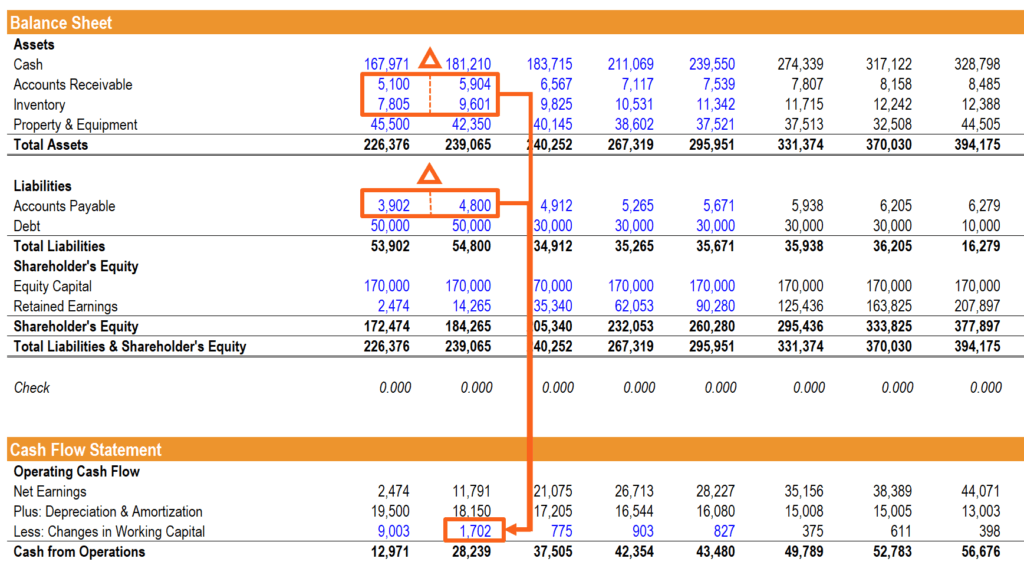
Modeling net working capital can sometimes be confusing. Changes in current assets and current liabilities on the balance sheet are related to revenues and expenses on the income statement, but need to be adjusted on the cash flow statement to reflect the actual amount of cash received or spent by the business. To achieve this, we create a separate section that calculates the changes in net working capital.
This can be a tricky part of linking the three statements and requires some additional schedules. Financing events, such as issuing debt, affect all three statements in the following way: the interest expense appears on the income statement, the principal amount of debt owed is recorded on the balance sheet, and the change in the principal amount owed is reflected in the cash from financing section of the cash flow statement.
In this section, it’s often necessary to model a debt schedule to incorporate the necessary detail required.
This is the final step in linking the 3 financial statements. Once all of the above items are linked up properly, the sum of cash from operations, cash from investing, and cash from financing are added to the prior period closing cash balance, and the result becomes the current period closing cash balance on the balance sheet.
This is the moment of truth when you discover whether or not your balance sheet balances!
If you get an interview question along the lines of, “How are the 3 financial statements linked together?” in an interview, you shouldn’t go into as much detail as above, but instead simply hit the main points, which are:
If you want to see a video-based example, watch CFI’s webinar on linking the 3 statements.
If you’re building a financial model in Excel it’s critical to be able to quickly link the three statements. In order to do this, there are a few basic steps to follow:
The model essentially inverts, where the historical period is hardcoded for the statements and calculations for the drivers, and then the forecast is hardcoded for the drivers and calculations for the financial statements.
Check out CFI’s step-by-step courses to learn how to build financial models in Excel.
Watch CFI’s live video demonstration of linking the 3 financial statements together in Excel.
We hope this has been a helpful guide on How the 3 Financial Statements are Linked Together. To keep learning more, please check out these relevant CFI resources: