Get Certified for Financial Modeling (FMVA)®
Gain in-demand industry knowledge and hands-on practice that will help you stand out from the competition and become a world-class financial analyst.
A free guide on building three-statement models in Excel
A 3-statement model links a company’s income statement, balance sheet, and cash flow statement into one dynamically connected financial model in Excel. It is used to forecast a company’s financial performance based on key assumptions and to produce a complete set of projected financial statements for budgeting, valuation, and decision-making.
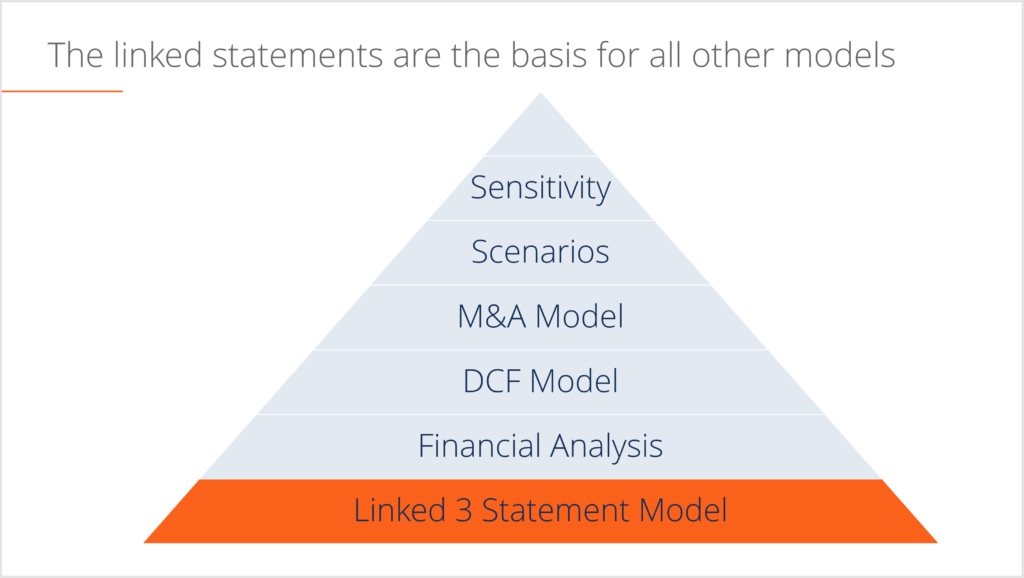
Three-statement models are the foundation on which more advanced financial models are built, such as discounted cash flow (DCF) models, merger models, leveraged buyout (LBO) models, and various other types of financial models.
For a ready-made three-statement model template in Excel, use our free case study template (see link below).
Need a 3-Statement Model Template?
If you want to start from a ready-built file instead of building from scratch, download our free 3-Statement Model Template in Excel in this case study.
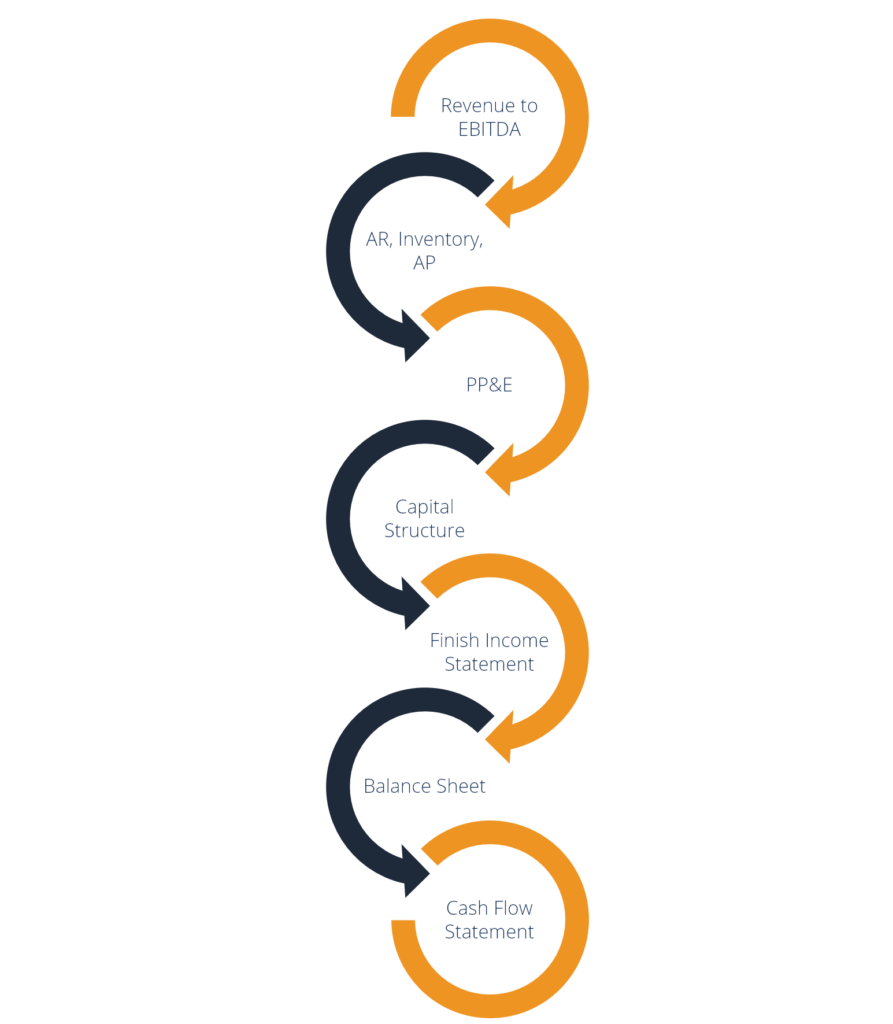
There are several steps required to build a three-statement model, including:
In this guide, we will walk you through each of the above steps. For a more detailed, video-based tutorial on how to build a model from scratch, enroll in CFI’s three-statement modeling course.
In this step, we take the historical financial information of the company and either download, type, or paste it into Excel. Once the information is in Excel, you’ll need to do some basic formatting to make the information easy to read and to make it follow the structure you want your model to take. As you can see in the screenshot below, the historical information is entered in a blue font color under the historical time periods.

With the historical financial information in Excel, and in an easy-to-use format, we can start calculating some metrics to evaluate the historical performance of the company. We need to calculate metrics such as revenue growth, margins, capital expenditures and working capital terms (such as accounts payable, inventory, and accounts receivable). Below is an example of the assumptions section, which drives the forecast.

With the assumptions in place, it’s time to start forecasting the income statement, beginning with revenue and building down to EBITDA (earnings before interest taxes depreciation and amortization). At that point, we will require supporting schedules to be built for items such as capital assets and financing activity.
At this point, we need to forecast capital assets such as property, plant, and equipment (PP&E), before we can finish the income statement in the model. To do this, we take the last period’s closing balance, and then add any capital expenditures, deduct depreciation, and arrive at the closing balance. Depreciation can be calculated in a variety of ways, such as straight line, declining balance, or percent of revenue.
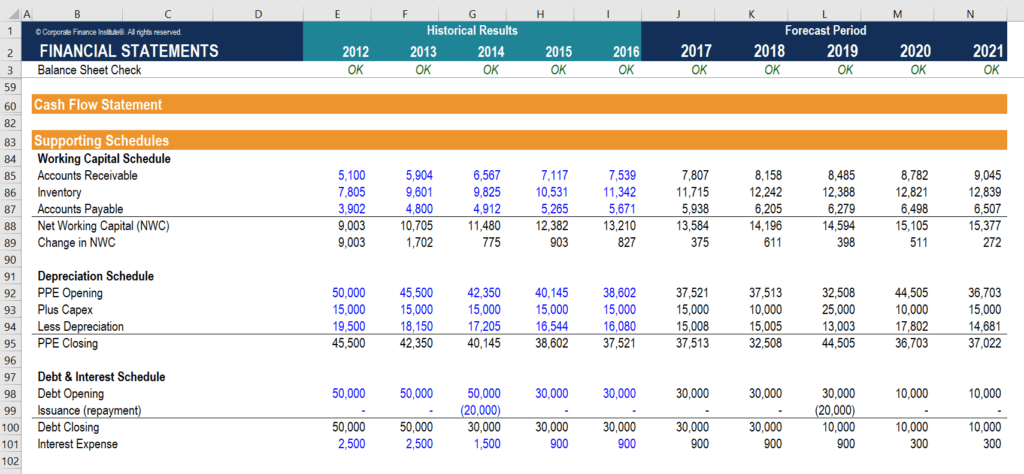
Next, we need to build a debt schedule to determine interest expense on the income statement. Similar to the section above, we take the last period’s closing balance, and then add any increases or decreases in debt, and arrive at the closing balance.
The interest expense can be calculated on the opening debt balance or the average debt balance. Alternatively, a detailed interest expense schedule can be followed if one is available.
Now that depreciation and interest expense have been forecast in the appropriate supporting schedules, these expenses can then be referenced back to the income statement, completing that core financial statement.
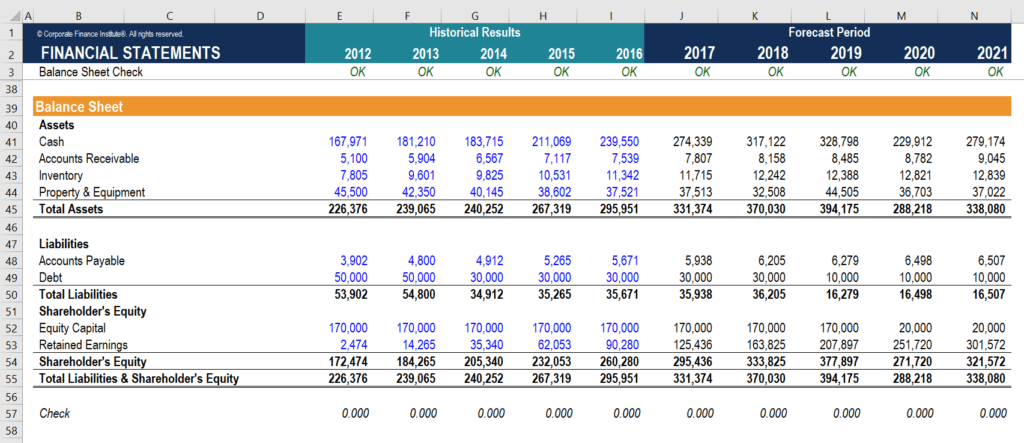
At this stage, it’s possible to essentially complete the balance sheet in our three-statement model, except for the cash balance, which will be the last step. Working capital items are forecast based on assumptions around average days payable and receivable, as well as inventory turns. Capital assets (PP&E, etc.) come from the schedule discussed above, as well as debt balances.
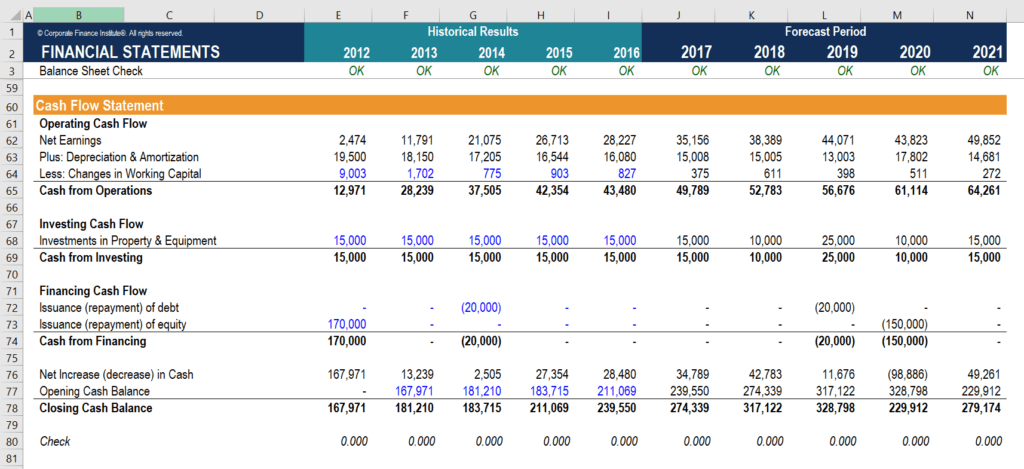
With the balance sheet completed (except for cash), we can build the cash flow statement and complete our three-statement model in Excel. This section is completed, essentially, by just linking to items that have already been calculated above in the model. We have to complete each of the three main sections: cash from operations, cash from investing and cash from financing.
There are two common approaches to structuring a three-statement model: single worksheet and multi-worksheet. While both approaches are acceptable, CFI strongly recommends using a single worksheet structure.
Advantages of a single worksheet model include the following:

Connect what you just learned to a clear career path with CFI’s role‑based courses and certification programs.


