Get Certified for Financial Modeling (FMVA)®
Gain in-demand industry knowledge and hands-on practice that will help you stand out from the competition and become a world-class financial analyst.
Estimating a company’s future performance by working “down” to revenue
Top-down forecasting is a method of estimating a company’s future performance by starting with high-level market data and working “down” to revenue. This approach starts with the big picture and then narrows in on a specific company. This guide will provide examples of how it works and explain why it’s commonly used in financial modeling and valuation.
Below is a top-down forecasting example for predicting Amazon’s future revenue growth.
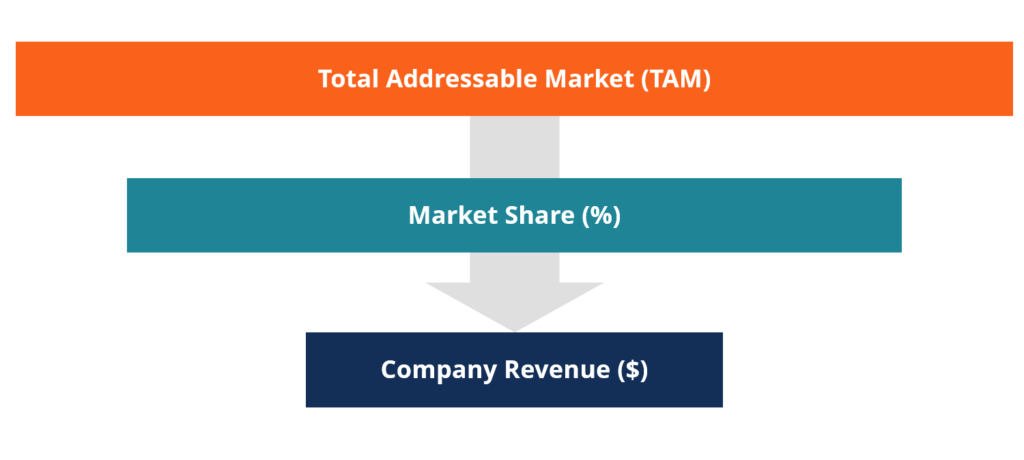
As you can see in the screenshot below, a financial analyst begins the analysis by outlining the Total Addressable Market (TAM) for each of Amazon’s business segments. This is a common place for starting a top-down analysis, although it is possible to start “further up” at something like Gross Domestic Product (GDP), for example.
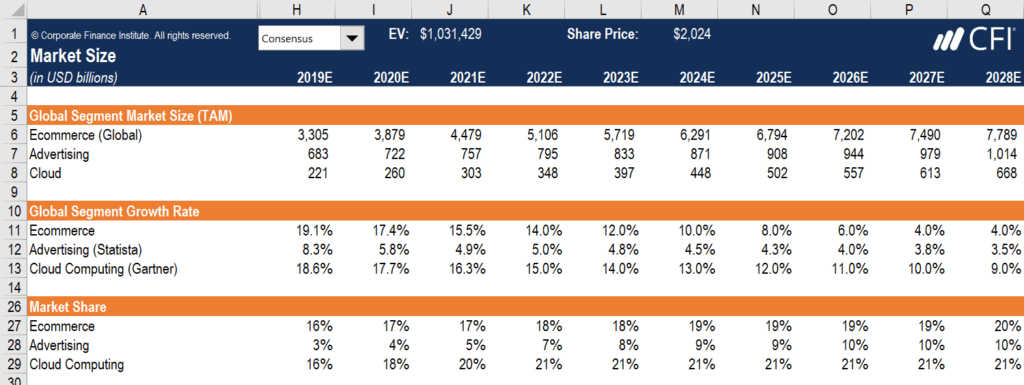
In Amazon’s case, since the company operates in several markets, it’s important to find the TAM for each segment. In the course, we provide the TAM figures from sources such as E-marketer, Statista, and Gartner.
The next step is to estimate how much market share you believe the company will capture in the future. Continuing with the Amazon course, you can see that we estimate the company will have a 20% share in the global E-commerce sector, 10% share in global advertising, and 21% share in global cloud computing by the end of 2028.
With the market share figures in place, we can calculate the company’s estimated revenue by multiplying the TAM by the percentage (%) of market share. Depending on the level of detail in your financial model, you may also wish to add other assumptions, such as the volume of order and the average prices of products or services being sold.
The opposite approach to top-down forecasting is called bottom-up forecasting, which begins with detailed assumptions such as the number of customers, volume of products, and unit prices to build “up” to revenue. It is also a very common method of building a forecast in financial modeling and valuation.
There are still several other forecast methods, in addition to top-down and bottom-up, such as regression analysis and Year-over-Year (YoY) analysis.
In regression analysis, a financial analyst uses Excel to calculate how changes in independent variables impact the dependent variable (revenue).
Year-over-Year analysis is the simplest method of forecasting, where an analyst will look at historical growth rates and apply a growth rate percentage to historical revenue.
Learn more about different forecasting methods in CFI’s Budgeting and Forecasting Course.
Thank you for reading CFI’s guide to Top-Down Forecasting. To learn more, these additional CFI resources will be helpful:


