Bottom-Up Forecasting

Estimating a company’s future performance by working “up” to revenue

Over 2 million + professionals use CFI to learn accounting, financial analysis, modeling and more. Unlock the essentials of corporate finance with our free resources and get an exclusive sneak peek at the first module of each course. Start Free

What is Bottom-Up Forecasting?

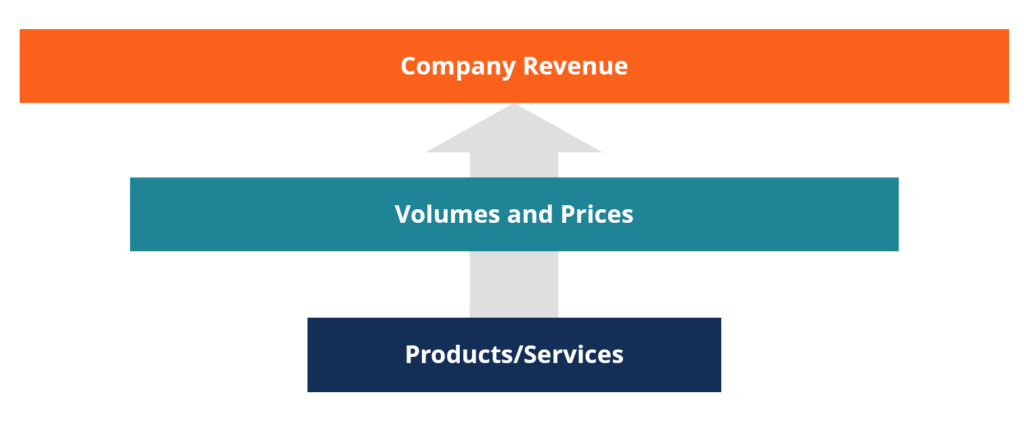
Bottom-up forecasting is a method of estimating a company’s future performance by starting with low-level company data and working “up” to revenue. This approach starts with detailed customer or product information and then broadens up to revenue. This guide will provide examples of how it works and explain why it’s commonly used in financial modeling and valuation.

Bottom-Up Forecasting Diagram

Example of Bottom-Up Forecasting

Below is a bottom-up forecasting example for predicting an E-commerce company’s future revenue growth. This example comes from CFI’s E-commerce Financial Modeling Course.

Step #1 Number of Orders (Sales Volume)

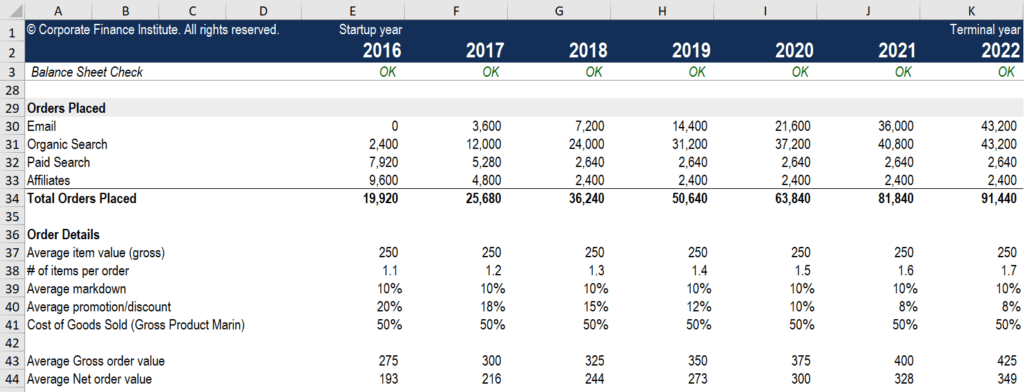
As you can see in the screenshot below, a financial analyst begins the analysis by outlining the total orders that will be placed for each of the company’s business channels. This is a common place for starting a bottom-up analysis, although it is possible to start “further down” at something like website traffic, for example.

Bottom-Up Market Analysis - Example

Image: CFI’s E-commerce Financial Modeling Course.

In this example, since the company sells its products through different marketing channels, it’s important to estimate the number of orders from each channel, and prices and costs may vary. In the course, we provide the estimated website traffic and conversion rates to arrive at the number of orders.

Step #2 Product/Service Prices

The next step is to estimate how much the company will charge customers for its products and/or services. Continuing with the E-commerce Course, you can see that we estimate the company charges an average of $275 per order in 2016, but after discounts and promotions, the net value per order is $193.

Step #3 Revenue

With the volume of orders and average net sales prices in place, we can calculate the company’s estimated revenue by multiplying the number of orders and the average price. Depending on the level of detail in your financial model, you may also wish to add other assumptions, such as returns, refunds, exchanges, chargebacks, and other items that may net out. You may also wish to include customer-level detail like total customers, retention rate, and churn rate.

Bottom-Up vs. Top-Down Forecasting

The opposite approach to bottom-up forecasting is called top-down forecasting, which begins with broad assumptions like Total Addressable Market (TAM) and market share to work “down” to revenue. It is also a very common method of building a forecast in financial modeling and valuation.

Alternative Forecasting Methods

There are several other forecast methods, in addition to top-down and bottom-up forecasting, such as regression analysis and Year-over-Year (YoY) analysis.

In regression analysis, a financial analyst uses Excel to calculate how changes in independent variables impact the dependent variable (revenue).

Year-over-Year analysis is the simplest method of forecasting where an analyst will look at historical growth rates and apply a growth rate percentage to historical revenue.

Learn more about different forecasting methods in CFI’s Budgeting and Forecasting Course.

Additional Resources

Thank you for reading CFI’s guide to Bottom-Up Forecasting. To learn more, these additional CFI resources will be helpful:

0 search results for ‘