Get Certified for Financial Modeling (FMVA)®
Gain in-demand industry knowledge and hands-on practice that will help you stand out from the competition and become a world-class financial analyst.
Methods used to estimate the amounts of fixed and variable costs
The high low method and regression analysis are the two main cost estimation methods used to estimate the amounts of fixed and variable costs. Usually, managers must break mixed costs into their fixed and variable components to predict and plan for the future.
Learn more in CFI’s Math for Corporate Finance Course.
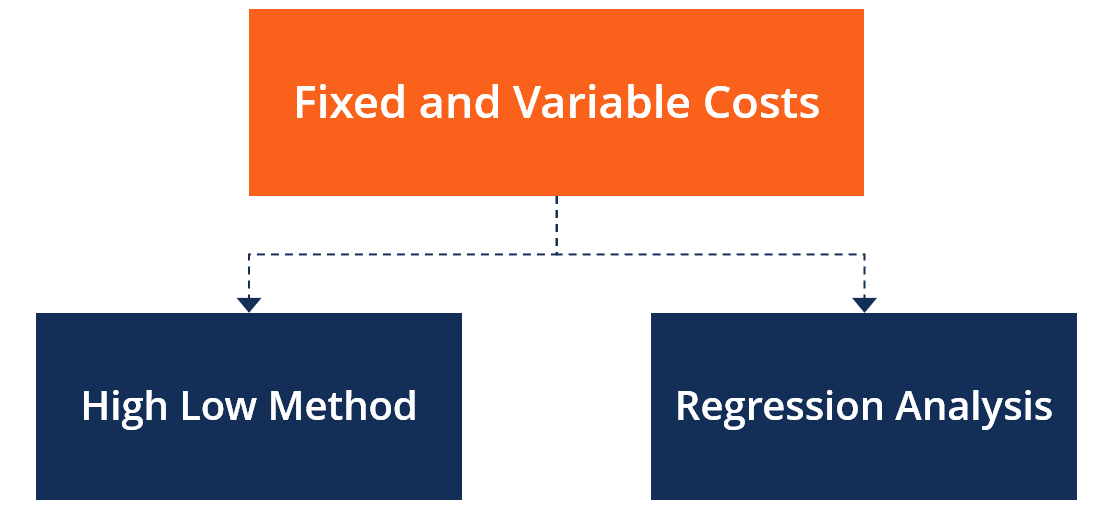
The high low method uses a small amount of data to separate fixed and variable costs. It takes the highest and lowest activity levels and compares their total costs. On the other hand, regression analysis shows the relationship between two or more variables. It is used to observe changes in the dependent variable relative to changes in the independent variable.
The high low method determines the fixed and variable components of a cost. It can be applied in discerning the fixed and variable elements of the cost of a product, machine, store, geographic sales region, product line, etc.
For example, in the production cost of a product, fixed costs may comprise employee’s wages and rental expenses, whereas variable costs include costs incurred in purchasing raw materials.
The high low method splits the variable and fixed components of mixed costs. The formulas for each component are as follows:
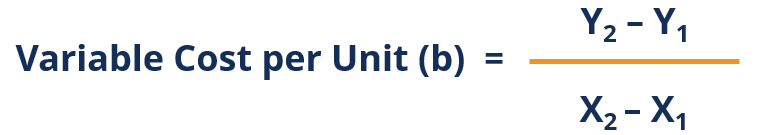
Where:
Y2 is the cost at the highest activity level
Y1 is the cost at the lowest activity level
X2 is the number of units at the highest activity level
X1 is the number of units at the lowest activity level
Once the variable cost has been calculated, the fixed cost can be derived by subtracting the total variable cost from the total cost. This is represented by the following formula:
or
Where:
b is the variable cost
Company ABC is a manufacturer of pharmaceuticals. The company wants to estimate the amount of overhead costs that it will incur in April, given that the company plans to make 8,000 units in that month. Following are the figures from January to March:
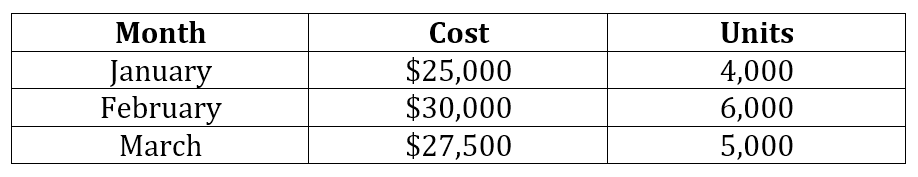
Using the variable cost formula above, where:
Y2 = $30,000
Y1 = $25,000
X2 = 6,000
X1 = 4,000
Therefore:
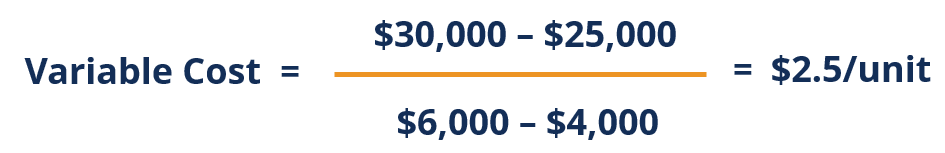
or
Projected variable cost for the month of April is calculated as follows:
= 2.5 x $8,000
= $20,000
Total cost = Fixed cost + Variable cost
= $15,000 + $20,000
= $35,000
Learn more in CFI’s Math for Corporate Finance Course.
Using the high low method offers the following benefits:
The high-low method only requires the cost and unit information at the highest and lowest activity level to get the required information. Managers can implement this technique with ease since it does not require any special tools.
The high low method can be relatively accurate if the highest and lowest activity levels are representative of the overall cost behavior of the company. However, if the two extreme activity levels are systematically different, then the high low method will produce inaccurate results.
The high low method comes with the following disadvantages:
The method does not represent all the data provided since it relies on just two extreme activity levels. Those activity levels may not be representative of the costs incurred, due to outlier costs that are higher or lower than what the organization incurs in other activity levels.
The high low method excludes the effects of inflation when estimating costs.
In contrast to the High Low Method, Regression analysis refers to a technique for estimating the relationship between variables. It helps people understand how the value of a dependent variable changes when one independent variable is variable while another is held constant. Regression analysis is used in forecasting future data. The two main types of regression analysis are linear regression and multiple regression.
Linear regression is a method that studies the relationship between continuous variables. The variables are plotted on a straight line. The linear regression can be calculated using the following formula:
Where:
Y is the dependent variable
X is the independent variable
b is the slope of the regression line
a is the intercept of the regression line
⋴ is the regression residual
From the formula above, we can deduce that the value of Y is dependent on the value of X, while the value of b shows the changes in Y every time the value of X changes. Meaning, if b equals 0.5, it means that every time X increases or increases by a specific value, the value of Y increases or decreases by that value. On the other hand, when X=0, the value of “a” equals the value of Y.
Multiple regression is a statistical technique that predicts the value of one variable using the value of two or more independent variables. Once each of the independent variables has been determined, they can be used to predict the amount of effect that the independent variables have on the dependent variable. The effect is represented on a straight line to approximate each of the data points.
Learn more in CFI’s Math for Corporate Finance Course.
The formula for multiple regression is as follows:
Where:
Y1 is the predicted value of the dependent variable
B0 is the intercept
B1, b2 … bn are the regression coefficient
x1, x2, …… xn are the independent variables
⋴ is the regression residual
Thank you for reading CFI’s comparison of the High Low Method and Regression Analysis. CFI offers the Financial Modeling & Valuation Analyst (FMVA)™ certification program for those looking to take their careers to the next level. To keep learning and advancing your career, the following CFI resources will be helpful:


