
Overview
Math for Finance Professionals Course Overview
Financial math is a critical tool for people working in the finance industry. Professionals within the industry need the skills to analyze financial data, manage financial risks, assess investment opportunities, and monitor transactions.
This course will provide you with the foundational math skills required to build a career in finance. You will compare simple and compound interest and learn how these different types of interest are used to compound and discount cash flows. You will also be introduced to the concepts of nominal and effective interest rates. You will then be ready to apply these skills to a variety of real-world finance applications.

Who Should Take Math for Finance Professionals Course?
This course is specifically designed for finance professionals seeking careers in investment banking, capital markets, risk management, investment and wealth management, finance, and accounting.
Math for Finance Professionals Learning Objectives
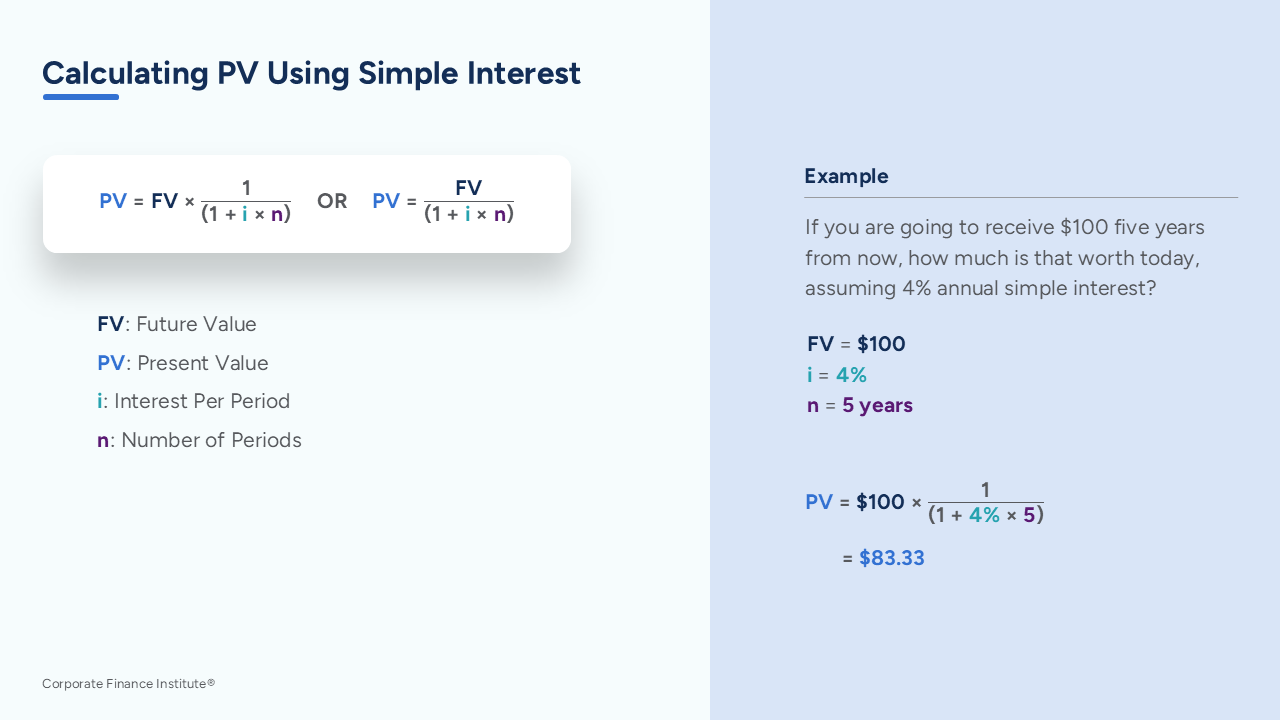
- Explain the difference between simple and compound interest
- Calculate and compare effective and nominal interest rates
- Build a range of discounted cash flow models that represent real-world applications
Prerequisite Skills
Recommended skills to have before taking this course.
- Basic Math

Level 2
3h
100% online and self-paced
Field of Study: Finance
Start LearningWhat You'll Learn
Simple and Compound Interest
Nominal and Effective Interest Rates
Discounted Cash Flows
Course Summary
Qualified Assessment
This Course is Part of the Following Programs
Why stop here? Expand your skills and show your expertise with the professional certifications, specializations, and CPE credits you’re already on your way to earning.
Financial Modeling & Valuation Analyst (FMVA®) Certification
- Skills Learned Financial modeling and valuation, sensitivity analysis, strategy
- Career Prep Investment banking and equity research, FP&A, corporate development
Capital Markets & Securities Analyst (CMSA®) Certification
- Skills Learned Trading strategies used in the finance and capital markets
- Career Prep Work in capital markets, whether on the buy-side or the sell-side
Financial Planning & Wealth Management Professional (FPWMP®) Certification
- Skills Learned Financial Learning, Business Development, Investment Management, Practice Management, Relationship Management
- Career Prep Financial Planner, Investment Advisor, Portfolio Manager
Risk Management Specialization
- Skills You’ll Gain Risk Identification, Regulatory Analysis, Risk Measurement, Risk Mitigation
- Great For: Market Risk Analyst, Credit Risk Analyst, Compliance Officer, consulting, Enterprise Risk Manager, Audit


