Get Certified for
Business Intelligence (BIDA®)
Develop analytical superpowers by learning how to use programming and data analytics tools such as VBA, Python, Tableau, Power BI, Power Query, and more.
An input, assumption, or driver that is changed in order to assess its impact on a dependent variable (the outcome)
An independent variable is an input, assumption, or driver that is changed in order to assess its impact on a dependent variable (the outcome). Think of the independent variable as the input and the dependent variable as the output. In financial modeling and analysis, an analyst typically performs sensitivity analysis in Excel, which involves changing assumptions in the model to observe the impact on an output.
When building an Excel model, an analyst needs to think carefully about how to set up an independent variable in the assumptions section. They are the inputs that will drive the model and the resulting outputs.
One of the best ways to select assumptions is to perform a root-cause analysis. For example, what causes revenue to fluctuate? Volume and price. What causes the volume to change? The number of products offered and the number of stores. The process continues until the analyst identifies all independent variables that can be used to drive the model.
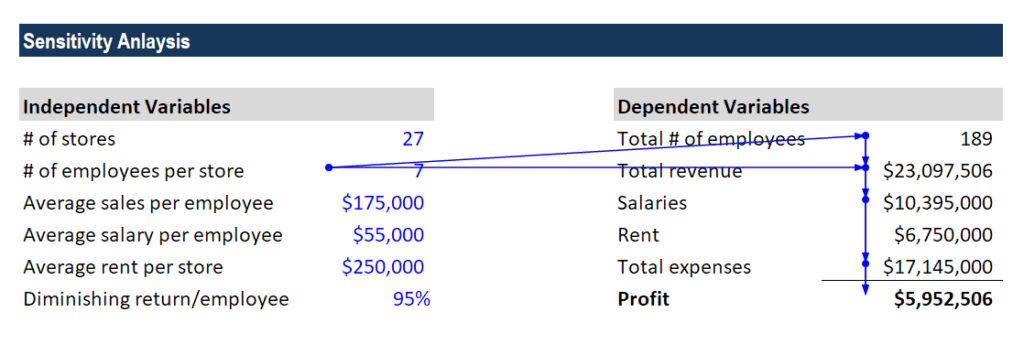
Once the variables have been determined and set up in Excel, the next task is to create formulas and functions that determine the outputs. For example, the number of stores times the number of products sold per store, times the average price per product equals total revenue.
After the function has been created, the dependent variable, revenue, will be impacted by changes in any of the underlying assumptions and drivers.
At this point, some tests should be performed to ensure the linking is properly set up and the dependent variable changes as expected with changes in the assumptions.
Once the model has been built, it’s time to start changing the assumptions and drivers to see their impact on the dependent variable, and to test hypotheses, run scenarios, and measure sensitivity.
For example, an analyst may begin to manually change each assumption and record the change in the dependent variable (in this case, revenue).
Another option is to create data tables in Excel that can record the numbers automatically and store them conveniently in a neat table.
Finally, the analyst may run discrete scenarios where a series of changes are made to assumptions with a story tied to them (for example, the company’s “optimistic case” scenario where everything goes well).
Let’s look at an example of how to set up a model that can change an independent variable to test a hypothesis and measure sensitivity to changes.
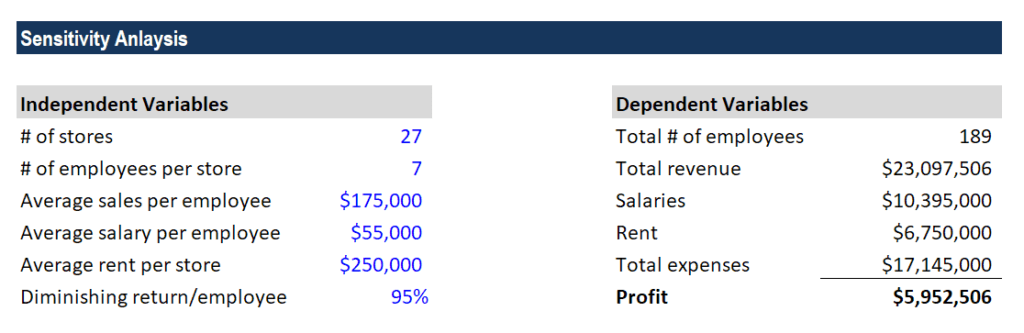
In this simple model we created, you can see the effect of changing a variable.
The question an analyst would ask is, given all the assumptions, what is the optimal number of employees per store that this company should operate with?
We know that employees generate an average of $175,000 each, but that there is a diminishing return of 5% to the power of the number of employees per store. Salaries per employee remain the same.
Download CFI’s sensitivity model template to test the numbers and calculate different scenarios on your own.
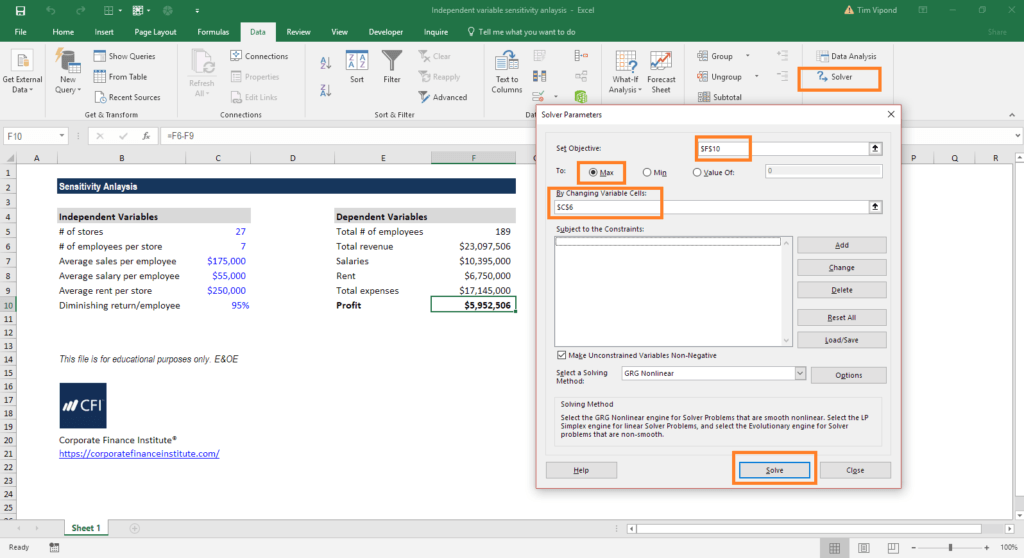
Based on the model, the optimal number of employees (the independent variable) is 10 per store, in order to maximize profit (the dependent variable).
The solution can be calculated using Excel’s solver function. Follow the screenshot below to check this solution on your own.
Here are the steps to take:
The result that’s displayed will be 10.
You can also manually test this solution by changing the independent variable until you arrive at the solution above.
Download CFI’s Excel template on Independent Variables.
Thank you for reading CFI’s guide to Independent Variable. To continue learning and advancing your career, these additional CFI resources will be useful:
Below is a break down of subject weightings in the FMVA® financial analyst program. As you can see there is a heavy focus on financial modeling, finance, Excel, business valuation, budgeting/forecasting, PowerPoint presentations, accounting and business strategy.

A well rounded financial analyst possesses all of the above skills!
CFI is the global institution behind the financial modeling and valuation analyst FMVA® Designation. CFI is on a mission to enable anyone to be a great financial analyst and have a great career path. In order to help you advance your career, CFI has compiled many resources to assist you along the path.
In order to become a great financial analyst, here are some more questions and answers for you to discover:


