Get Certified for Financial Modeling (FMVA)®
Gain in-demand industry knowledge and hands-on practice that will help you stand out from the competition and become a world-class financial analyst.
Historical data forms the basis of most financial forecasts, but it can’t account for everything. External factors like policy changes, new competitors, or shifting consumer preferences often have no precedent in past performance.
To build accurate, forward-looking projections, financial analysts rely on a mix of qualitative frameworks and quantitative techniques. Qualitative methods help incorporate context and expert judgment, while quantitative tools provide the structure to model trends and test assumptions objectively.
Together, these techniques create forecasts that are not only grounded in data but also informed by business and market realities.

PEST analysis provides a framework for building qualitative expectations about the future. The acronym covers four key factors that can influence your forecasts: Political, Economic, Social, and Technological.
Start with PEST analysis before diving into quantitative methods. It reveals trends that might present game-changing opportunities or hidden threats to your forecast assumptions.
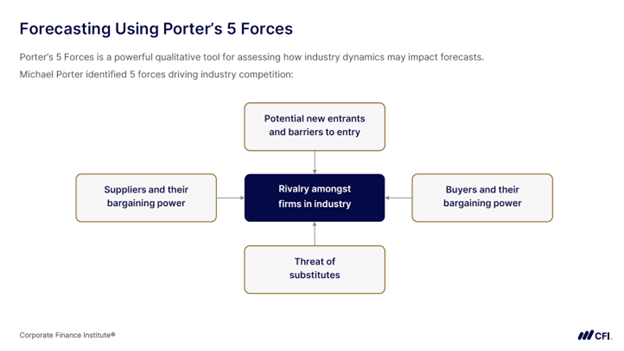
Porter’s Five Forces is a powerful qualitative tool for assessing how industry dynamics affect forecasts. Developed by strategy expert Michael Porter, this approach identifies five forces that drive industry competition and affect your growth projections:
When to use it: Apply Porter’s Five Forces to identify factors that could increase or limit a company’s forecasted growth.
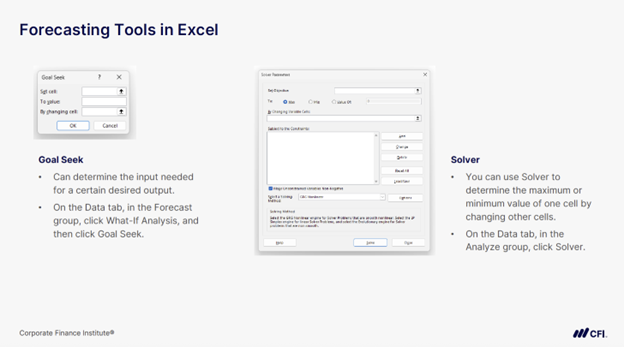
Goal Seek is an Excel tool that determines the input needed for a specific desired output. Located in the Data tab under What-If Analysis, this powerful feature solves for one variable when you know your target outcome.
Suppose you have a $4 million budget limit for total staffing costs. You’ve set the number of full-time employees and their salaries but need to determine what you can pay contractors to stay under budget. Goal Seek calculates that exact contractor rate for you. Similarly, if your budget increased to $5 million, Goal Seek could tell you exactly how much you could raise full-time employee salaries.
When to use it: Perfect when you have a specific target and need to find the one input that achieves it.
Excel Solver takes a different approach than Goal Seek by finding optimal solutions when you don’t know the target. This optimization tool determines maximum or minimum values by changing multiple variables within specified constraints.
Imagine you work on a finance team for a company that needs a certain number of total employees but wants to keep payroll costs under control. You set pay levels for full-time employees and contractors and use Solver to determine the optimal mix of full-time versus contract workers. This function enables you to identify acceptable payroll expenses, while meeting your staffing requirements.
When to use it: Choose Solver for optimization problems where you want the best possible outcome (maximum revenue, minimum costs) given certain limitations.
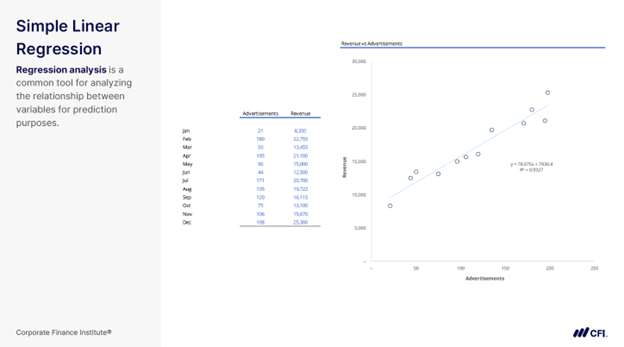
Simple linear regression analyzes the relationship between one independent variable and one dependent variable for prediction purposes. It’s “simple” because it uses just one predictor.
The image below shows an example. Imagine you’re analyzing your organization’s historical advertising and revenue data (see the table in the slide). You find this relationship: y = 78.075x + 7,930.40. This equation provides the following information:
When to use it: Apply simple linear regression when you have historical data showing a clear relationship between one driver and your outcome. The closer data points cluster around the trend line, the stronger your forecast.
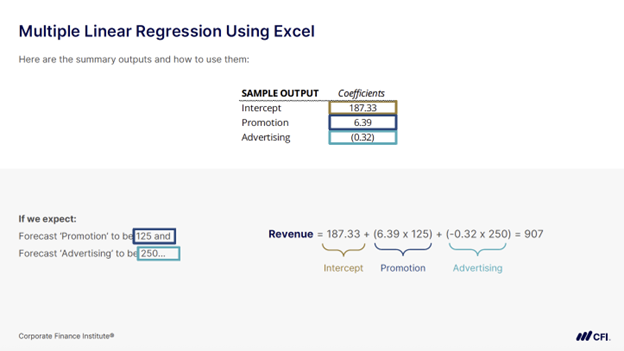
Multiple linear regression compares two or more independent variables with one dependent variable. This technique recognizes that business outcomes rarely depend on single factors.
Using Excel’s Analysis ToolPak, you can analyze how multiple drivers affect results. The image below provides an example of a company’s finance team analyzing how promotion and advertising spending affect revenue. They discovered:
This reveals that promotion spending drives revenue growth while advertising spending shows no clear impact.
When to use it: Choose multiple regression when several factors influence your outcome and you need to understand each variable’s contribution to build accurate forecasts.
Excel’s FORECAST.ETS function uses the Exponential Triple Smoothing (ETS) algorithm to predict future values based on historical patterns. This sophisticated tool shines at handling seasonal businesses by automatically detecting and continuing both seasonality and growth trends.
The function requires consistent time intervals in your data, then automatically detects and continues seasonal patterns. For a business with quarterly seasonality, FORECAST.ETS picks up the seasonal pattern while maintaining the underlying growth trajectory. You can pair it with FORECAST.ETS.CONFINT to add confidence intervals, showing upper and lower bounds for your predictions. Tighter intervals indicate higher forecast confidence.
When to use it: Perfect for businesses with clear seasonal patterns in their historical data. Whether you’re forecasting monthly retail sales or quarterly service revenues, this function handles the mathematical complexity for you.
Each of these forecasting techniques helps you produce more reliable projections, support smarter decisions, and earn trust across your organization. When you’re confident using both qualitative frameworks and quantitative tools, you’re better equipped to take ownership of forecasts that leaders rely on.
Ready to level up your forecasting skills? CFI’s Financial Planning & Analysis Professional (FPAP™) Certification prepares you to succeed in an FP&A role, from building and presenting forecasts and supporting financial planning to delivering insights leaders can act on. You’ll develop the practical skills finance teams expect from day one, with training trusted by leading finance teams at Amazon, JPMorgan, and PwC.
4 Forecasting Models Compared (And When You Should Use Each)


