Get Certified for
Business Intelligence (BIDA®)
Develop analytical superpowers by learning how to use programming and data analytics tools such as VBA, Python, Tableau, Power BI, Power Query, and more.
A probability measure of finding the observed, or more extreme results, when the null hypothesis of a given statistical test is true
In statistical hypothesis testing, the p-value (probability value) is a probability measure of finding the observed, or more extreme, results, when the null hypothesis of a given statistical test is true. The p-value is a primary value used to quantify the statistical significance of the results of a hypothesis test.
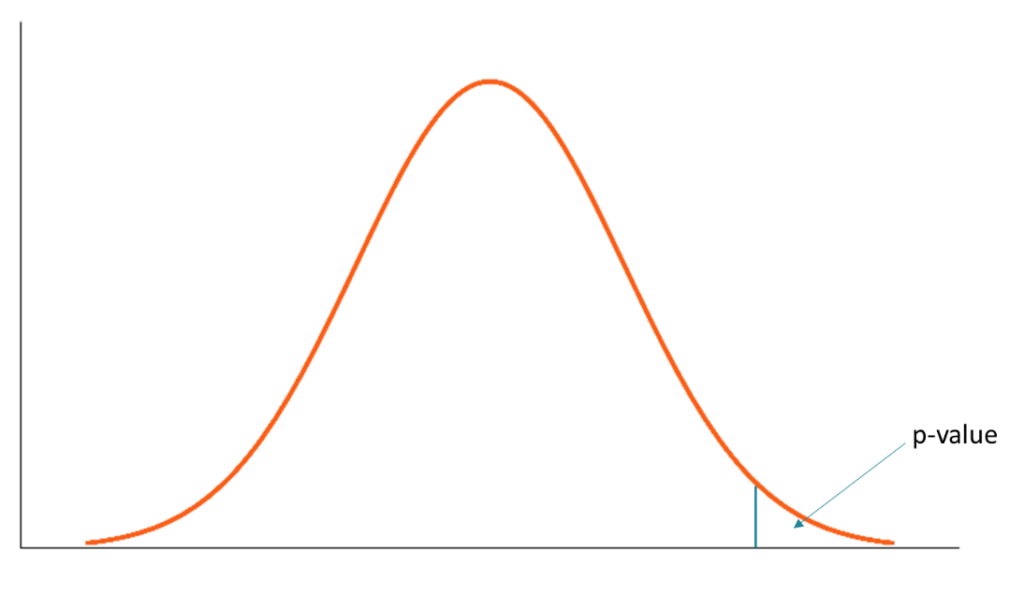
The main interpretation of the p-value is whether there’s enough evidence to reject the null hypothesis. If the p-value is reasonably low (less than the level of significance), we can state that there is enough evidence to reject the null hypothesis. Otherwise, we should not reject the null hypothesis.
The conclusions about the hypothesis test are drawn when the p-value of a test is compared against the level of significance, which plays the role of a benchmark. The most typical levels of significance are 0.10, 0.05, and 0.01. The level of significance of 0.05 is considered conventional and the most commonly used.
In order to use the p-value in hypothesis testing, follow the steps below:
The degree of statistical significance generally varies depending on the level of significance. For example, a p-value that is more than 0.05 is considered statistically significant while a figure that is less than 0.01 is viewed as highly statistically significant.
In statistics, the p-value can be truly considered as one of the most commonly misinterpreted concepts. The biggest misconception about the concept is that it is a probability that the null hypothesis is true (or it is a probability that the alternative hypothesis is false).
In reality, the p-value does not determine the probability of the null hypothesis to be true but merely indicates the probability of encountering the results of a study at least as extreme as the actually observed results if the null hypothesis is true. In other words, it indicates the probability of having enough evidence to reject or not to reject the null hypothesis.
CFI offers the Business Intelligence & Data Analyst (BIDA)® certification program for those looking to take their careers to the next level. To keep learning and advancing your career, the following CFI resources will be helpful:


