Get Certified for
Business Intelligence (BIDA®)
Develop analytical superpowers by learning how to use programming and data analytics tools such as VBA, Python, Tableau, Power BI, Power Query, and more.
A statistical test to support your hypothesis
Hypothesis Testing is a method of statistical inference. It is used to test if a statement regarding a population parameter is statistically significant. Hypothesis testing is a powerful tool for testing the power of predictions.
A Financial Analyst, for example, might want to make a prediction of the mean value a customer would pay for her firm’s product. She can then formulate a hypothesis, for example, “The average value that customers will pay for my product is larger than $5.” To statistically test this question, the firm owner could use hypothesis testing. This example is further explored down below.
Hypothesis Testing is a critical part of the scientific method, which is a systematic approach to assessing theories through observation. A good theory is one that can make accurate predictions. For an analyst who makes predictions, hypothesis testing is a rigorous way of backing up his prediction with statistical analysis.

Here are the steps for hypothesis testing:
The Null Hypothesis is usually set as what we don’t want to be true. It is the hypothesis to be tested. Therefore, the Null Hypothesis is considered to be true until we have sufficient evidence to reject it. If we reject the null hypothesis, we are led to the alternative hypothesis.
Going back to our initial example of the business owner who is looking for some customer insight. Her null hypothesis would be:
H0 : The average value customers are willing to pay for my product is smaller than or equal to $5
or
H0 : µ ≤ 5
(µ = the population mean)
The alternative hypothesis would then be what we are evaluating, so, in this case, it would be:
Ha : The average value customers are willing to pay for the product is greater than $5
or
Ha : µ > 5
It is important to emphasize that the alternative hypothesis will only be considered if the sample data that we gather provide evidence for it.
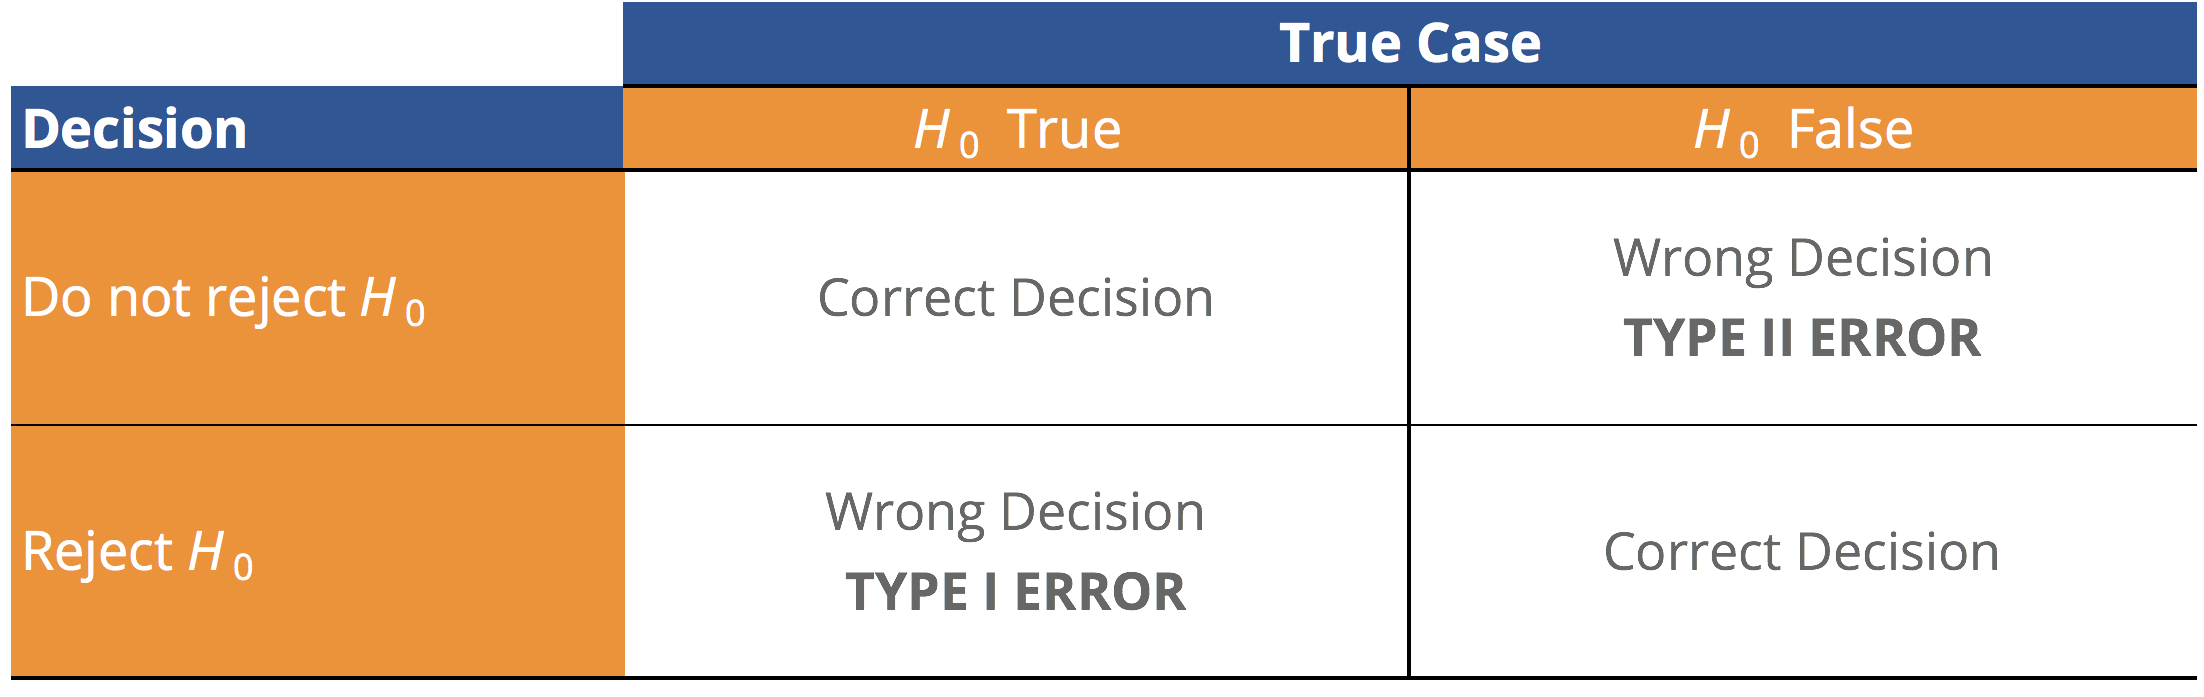
The binary nature of our decision, to reject or fail to reject the null hypothesis, gives rise to two possible errors. The table below illustrates all of the possible outcomes. A Type I Error arises when a true Null Hypothesis is rejected. The probability of making a Type I Error is also known as the level of significance of the test, which is commonly referred to as alpha (α). So, for example, if a test that has its alpha set as 0.01, there is a 1% probability of rejecting a true null hypothesis or a 1% probability of making a Type I Error.
A Type II Error arises when you fail to reject a False Null Hypothesis. The probability of making a Type II Error is commonly denoted by the Greek letter beta (β). β is used to define the Power of a Test, which is the probability of correctly rejecting a false null hypothesis. The Power of a Test is defined as 1-β. A test with more Power is more desirable, as there is a lower probability of making a Type II Error. However, there is a tradeoff between the probability of making a Type I Error and the probability of making a Type II Error.
Let’s go back to the business owner example. Let us remember the question that we are trying to answer:
Q: “Will customers pay, on average, more than $5 for our product?”
1. We have set above both the null and alternative hypothesis
H0 : µ ≤ 5
Ha : µ > 5
2. For this example, let us assume that the firm sells organic apple juice boxes. They are consumed by a wide range of consumers of all ages, income levels, and cultural backgrounds. So, given that our product is widely used by a diverse group of consumers, assuming a normal distribution is fair.
3. Let us assume that by getting samples from our consumers, we will manage to get over 100 observations. Given we are confident with our assumption of a normal distribution for the underlying population and have a large number of observations, we will use a z-test.
4. We want to be confident of our result, so let us pick our significance level as α = 5%. This will provide strong evidence of our result.
5. We are using a z-test with a significance level, and the null hypothesis is µ ≤ 5, so our rejection point will be z0.05 =1.645. This means that if the z score calculated from our sample is greater than 1.645, we reject the null hypothesis.
6. Now assume that we have collected our data and that from our sample of 100 observations, the mean price that customers are willing to pay for our juices is $5.02 and that the sample standard deviation was $0.10. We can now calculate the z-score for our sample where we get a value of 2 given by [(5.02 – 5) / ( 0.1/ √100)].
7. Given our calculated z is greater than z0.05 =1.645, we have strong evidence to reject the null hypothesis at a 5% significance level. We are then in favor of the alternative hypothesis that the average value customers are willing to pay for the product is greater than $5.
8. We now need to take into consideration any economic or qualitative issues that are not addressed through the statistical process. These are usually non-quantifiable variables that have to be addressed when making a decision based on the findings. For example, if the biggest competitor was going to lower the price of the competing product significantly, that may lower the average value consumers are willing to pay for your product.
If you want to learn more about topics related to Hypothesis Testing, check out resources on the Royal Statistics Society website. To keep learning and advancing your career, the following CFI resources will also be helpful:


