Get Certified for
Business Intelligence (BIDA®)
Develop analytical superpowers by learning how to use programming and data analytics tools such as VBA, Python, Tableau, Power BI, Power Query, and more.
A test statistic used in statistics to detect autocorrelation in the residuals from a regression analysis
The Durbin Watson statistic is a test statistic to detect autocorrelation in the residuals from a regression analysis. It is named after professor James Durbin, a British statistician and econometrician, and Geoffrey Stuart Watson, an Australian statistician.
Serial correlation, also called autocorrelation, refers to the degree of correlation between the values of variables across different data sets. It is usually used when working with time series data in which observations occur at different points in time (e.g., wind speed measured on different days of the week). If the wind speed values measured that occurred closer in time are more similar than the values that occurred farther apart in time, the data is said to be correlated.
In statistics, residuals are nothing but the difference between the observed value and the mean value that a particular model predicts for that observation. Residual values are extremely useful in regression analysis as they indicate the extent to which a model accounts for the variation in the given data.
Regression analysis is a method used in statistics that helps to identify which variables exert an impact on a particular experiment topic. The process helps determine which factors matter the most, which are to be ignored, and how the factors influence each other. Variables play an important role in regression, and it is important to understand the types of variables:
Dependent Variable: The main factor that is being understood or predicted in the experiment, dependent on other variables
Independent Variable: Variables that impact the dependent variable
The hypotheses followed for the Durbin Watson statistic:
H(0) = First-order autocorrelation does not exist.
H(1) = First-order autocorrelation exists.
The assumptions of the test are:
The formula for the test is:
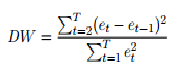
Where:
The Durban Watson statistic will always assume a value between 0 and 4. A value of DW = 2 indicates that there is no autocorrelation. When the value is below 2, it indicates a positive autocorrelation, and a value higher than 2 indicates a negative serial correlation.
To test for positive autocorrelation at significance level α (alpha), the test statistic DW is compared to lower and upper critical values:
If DW < Lower critical value: There is statistical evidence that the data is positively autocorrelated
If DW > Upper critical value: There is no statistical evidence that the data is positively correlated.
If DW is in between the lower and upper critical values: The test is inconclusive.
To test for negative autocorrelation at significance level α (alpha), the test statistic 4-DW is compared to lower and upper critical values:
If 4-DW < Lower critical value: There is statistical evidence that the data is negatively autocorrelated.
If 4-DW > Upper critical value: There is no statistical evidence that the data is negatively correlated.
If 4-DW is between the lower and upper critical values, The test is inconclusive.
Though there are many ways to use the test as an indicator in the stock market.
One important way of using the test is to predict the price movement of a particular stock based on historical data. If the test is used on a stock and displays a positive serial correlation, it suggests that yesterday’s stock price shows a positive correlation with the price today. So, if the price increased yesterday, it would most likely increase today.
Similarly, if the stock price fell yesterday, it is likely to fall today. However, if the test displays a negative serial correlation, it indicates that if the price rose yesterday, it would most likely fall today.
One more important use of serial correlation is technical analysis. Technical analysis of a stock is checking previous trends and using techniques to gauge financial health and make predictions. In most cases, a stock’s past prices impact its future price, and thus, autocorrelation is a suitable tool to use.
Connect what you just learned to a clear career path with CFI’s role‑based courses and certification programs.
CFI is the official provider of the Business Intelligence & Data Analyst (BIDA)® certification program, designed to transform anyone into a world-class financial analyst.
In order to help you become a world-class financial analyst and advance your career to your fullest potential, these additional resources will be very helpful:


