Get Certified for
Business Intelligence (BIDA®)
Develop analytical superpowers by learning how to use programming and data analytics tools such as VBA, Python, Tableau, Power BI, Power Query, and more.
A statistical measure of the relationship between two variables
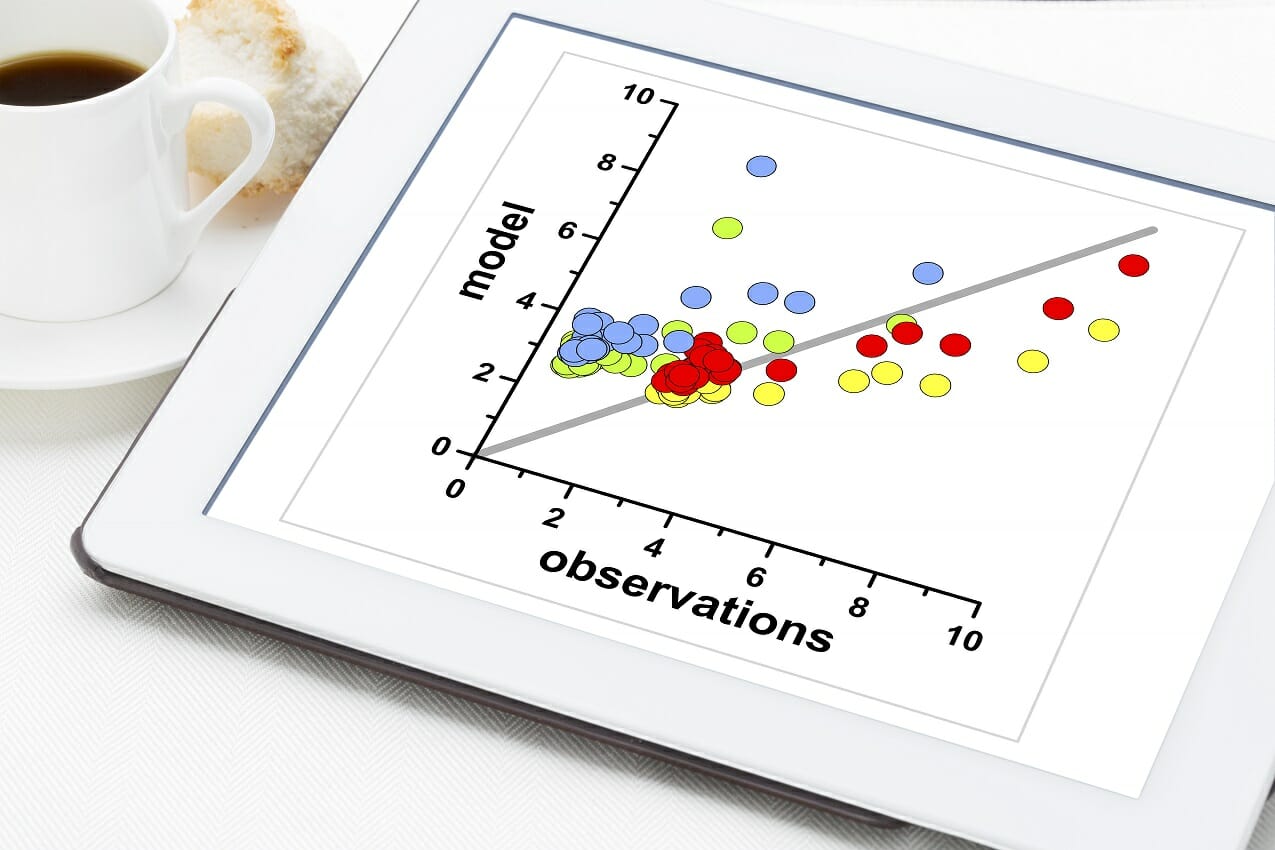
A correlation is a statistical measure of the relationship between two variables. The measure is best used in variables that demonstrate a linear relationship between each other. The fit of the data can be visually represented in a scatterplot. Using a scatterplot, we can generally assess the relationship between the variables and determine whether they are correlated or not.
The correlation coefficient is a value that indicates the strength of the relationship between variables. The coefficient can take any values from -1 to 1. The interpretations of the values are:
One of the primary applications of the concept in finance is portfolio management. A thorough understanding of this statistical concept is essential to successful portfolio optimization.
Correlation must not be confused with causality. The famous expression “correlation does not mean causation” is crucial to the understanding of the two statistical concepts.
If two variables are correlated, it does not imply that one variable causes the changes in another variable. Correlation only assesses relationships between variables, and there may be different factors that lead to the relationships. Causation may be a reason for the correlation, but it is not the only possible explanation.
CFI’s Math for Corporate Finance Course explores the financial mathematics concepts required for financial modeling.
The correlation coefficient that indicates the strength of the relationship between two variables can be found using the following formula:
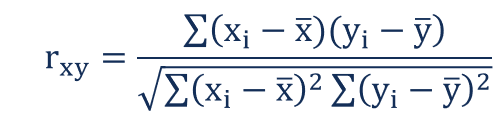
Where:
In order to calculate the correlation coefficient using the formula above, you must undertake the following steps:
You can see that the manual calculation of the correlation coefficient is an extremely tedious process, especially if the data sample is large. However, there are many software tools that can help you save time when calculating the coefficient. The CORREL function in Excel is one of the easiest ways to quickly calculate the correlation between two variables for a large data set.
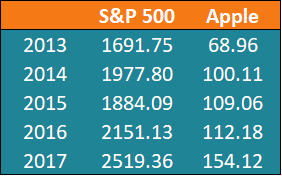
John is an investor. His portfolio primarily tracks the performance of the S&P 500 and John wants to add the stock of Apple Inc. Before adding Apple to his portfolio, he wants to assess the correlation between the stock and the S&P 500 to ensure that adding the stock won’t increase the systematic risk of his portfolio. To find the coefficient, John gathers the following prices for the last five years (Step 1):
Using the formula above, John can determine the correlation between the prices of the S&P 500 Index and Apple Inc.
First, John calculates the average prices of each security for the given periods (Step 2):
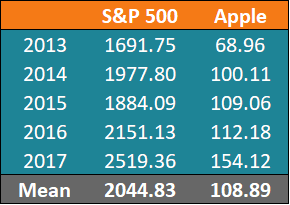
After the calculation of the average prices, we can find the other values. A summary of the calculations is given in the table below:
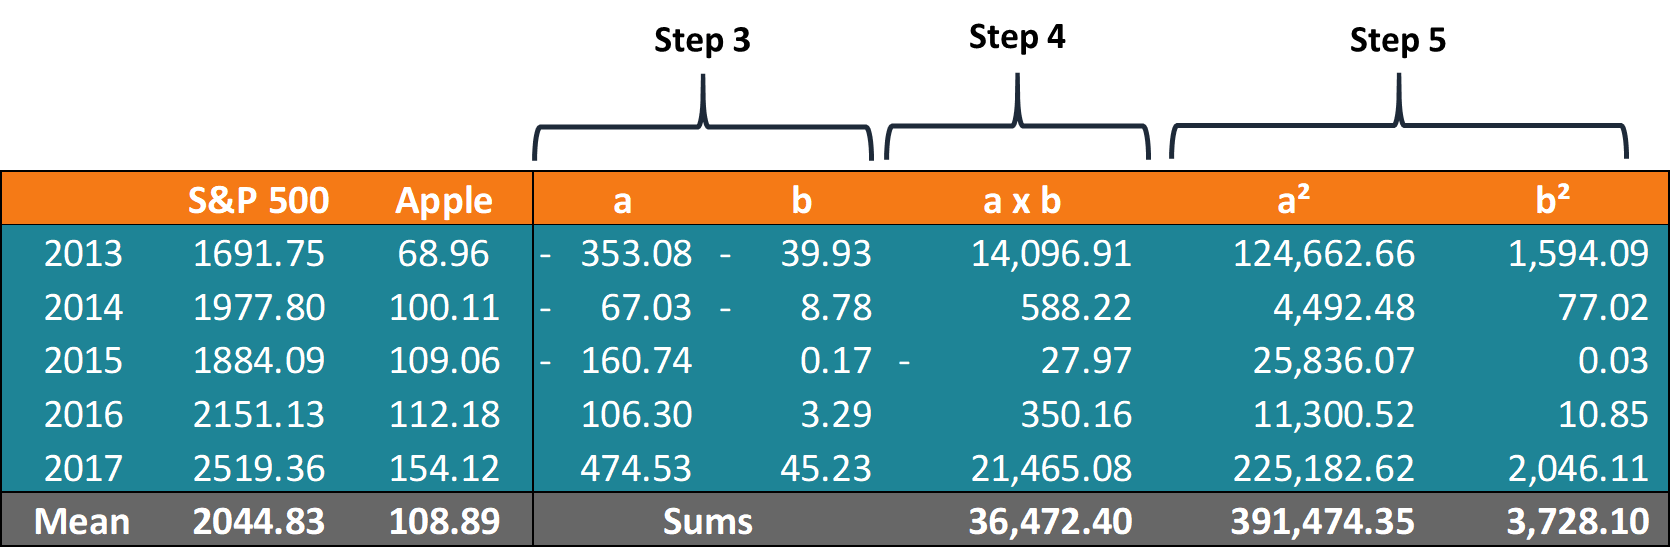
Using the obtained numbers, John can calculate the coefficient:
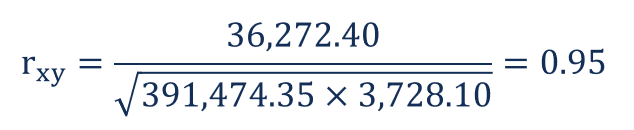
The coefficient indicates that the prices of the S&P 500 and Apple Inc. have a high positive correlation. This means that their respective prices tend to move in the same direction. Therefore, adding Apple to his portfolio would, in fact, increase the level of systematic risk.
Connect what you just learned to a clear career path with CFI’s role‑based courses and certification programs.
Thank you for reading CFI’s explanation of Correlation. To keep learning and developing your knowledge of financial analysis, we highly recommend the additional CFI resources below:


