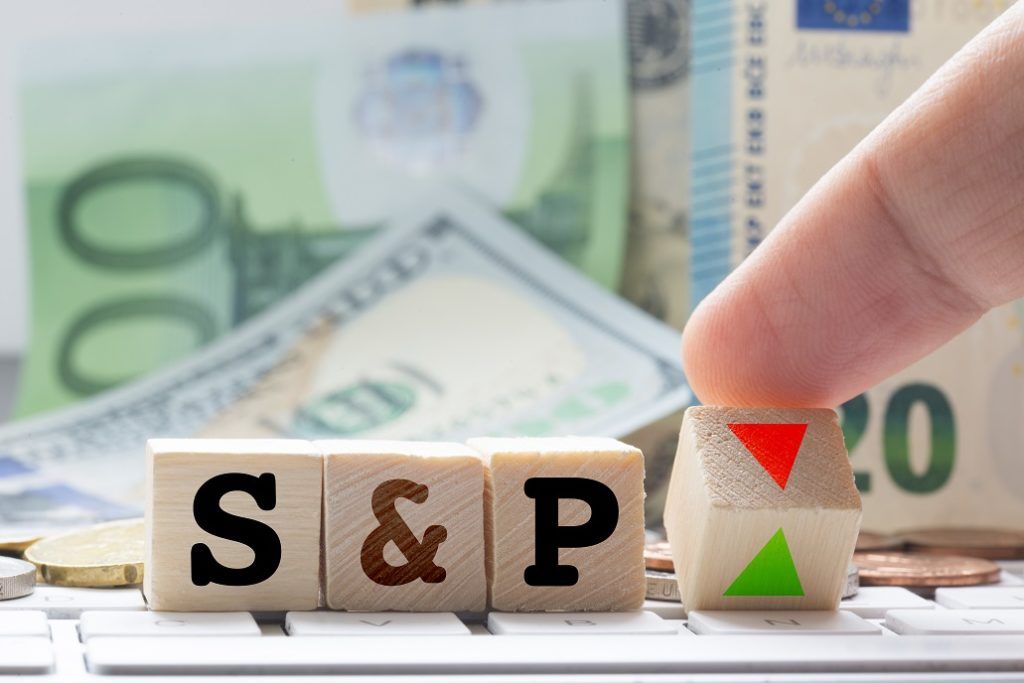
S&P – Standard and Poor’s

A complete overview of all Standard and Poor's products

Over 2 million + professionals use CFI to learn accounting, financial analysis, modeling and more. Unlock the essentials of corporate finance with our free resources and get an exclusive sneak peek at the first module of each course. Start Free

What is Standard and Poor’s (S&P)?

Standard & Poor’s is an American financial intelligence company that operates as a division of S&P Global. S&P is a market leader in the provision of financial market analysis, particularly in the provision of benchmark and investable indices and credit ratings for companies and countries.

S&P - Standard and Poor's

The S&P Global division includes:

  1. Global Ratings
  2. Global Market Intelligence
  3. Dow Jones Indices
  4. Global Platts

To learn more, launch our free finance courses!

History of Standard and Poor’s

The origin of Standard and Poor’s began in 1860. Henry Varnum Poor published a book called “History of Railroads and Canals in the United States.” The book provided a comprehensive coverage of the operational and financial state of railroad companies in the U.S. In 1868, Henry Varnum Poor and Henry William Poor created “H.V and H.W. Poor Co.,” which published two guidebooks that were updated annually.

The Standard Statistics Company was established in 1906, providing financial information regarding non-railroad companies. The Standard Statistics Company published its first stock market indicator in 1923, based on 233 companies.

Standard & Poor’s came into being in 1941 when Poor’s Publishing and the Standard Statistics Bureau merged. It increased the number of companies on the basis of which the stock index was computed to 416.

Later in 1966, The McGraw Companies acquired Standard & Poor’s Corporation, now known as S&P Global, after it rebranded in 2016.

Branches of Standard and Poor’s

The Standard and Poor’s Global division includes the following divisions:

1. Global Ratings

S&P Global Ratings is a market leader in the field of credit risk research. Global Ratings covers various industries, asset classes, geographies, and benchmarks for the benefit of multiple investors. As of 2016, it already issued 1.2 million credit ratings on corporations, securities, financial sectors, and governments and held rated debt worth $47.5 trillion.

What is the S&P Credit Rating Process?

The S&P Global Ratings credit rating process is as follows:

  1. Contract – The issuing company requests a credit rating and formalizes the request by signing an engagement letter.
  2. Pre-Evaluation – S&P Global Ratings creates a team of analysts who review all relevant information.
  3. Management Meeting – The analyst team meets the management team to discuss the information procured in step 2.
  4. Analysis – The information is evaluated by the analysts. On the basis of this analysis, a rating is proposed to the rating committee by the analyst team.
  5. Rating Committee – The rating committee votes on the credit rating, based on the recommendation of the analyst team after reviewing the same.
  6. Notification – The issuing company is provided with a pre-publishing rationale for the credit rating assigned to it so that the rationale can be fact-checked.
  7. Publication – A public rating is published in a press release and at www.standardandpoors.com
  8. Surveillance of Rated Issuers & Issues – Surveillance is carried out to update the credit rating to keep it relevant, i.e., to downgrade or upgrade the rating if required.
  9. Performance Review – S&P Global Ratings conducts studies to measure the performance and accuracy of their credit ratings. This process involves tracking transitions and default rates and measuring how much credit ratings have changed over a period of time.
  10. The performance review is used by various agencies to refine their analytical methods for forming ratings opinions. The performance review also allows individuals and investors to see the relative volatility/stability of credit ratings.

To learn more, launch our free finance courses!

2. Dow Jones Indices

S&P Dow Jones Indices is the world’s largest source of indices and is used by various classes of investors to find global investment opportunities. In 2012, Standard & Poor’s merged its index operations with those of Dow Jones Indexes and thus created an absolute market leader in the industry.

S&P 500 Index

The S&P 500 index – the first stock market index to be published daily – was launched in 1957. It is a leading indicator of the health of the U.S. stock market, despite the fact that it only includes large-cap companies because it includes a large part of the total worth of publicly-traded American companies.

How is the S&P 500 Index Calculated?

The following steps are undertaken to calculate the S&P 500:

Step 1: Selecting the companies – The S&P 500 index is based on 500 stocks belonging to companies that are considered to be leading indicators of the American equity market. It is a measure of the value of the shares belonging to the largest 500 companies (according to market capitalization) on the Nasdaq Composite/New York Stock Exchange.

The 500 companies on which the S&P 500 is based are chosen by the Index Committee. The Index Committee is comprised of economists and analysts employed by Standard & Poor’s. The companies are selected on the basis of:

  • Liquidity
  • Market size
  • industry

Step 2: Calculation – The formula for calculating the S&P 500 is as follows:

Index = Sum of the Adjusted or Weighted Market Cap of All S&P 500 Stocks / Index Divisor

Index divisor: The index divisor is a proprietary figure which has been developed by S&P’s. Multiple sources peg the index divisor at 8.9 billion. It ensures that the S&P index is not affected by non-economic factors. The index divisor is adjusted in the event of:

  1. Stock splits
  2. Special dividends
  3. Spinoffs

Adjusted/weighted market cap of all S&P 500 stocks: The adjusted market capitalization of each individual company is arrived at by using the following formula:

Weighting = Market Capitalization of Individual Component / Sum of the Market Capitalization of All S&P 500 Stocks

Advantages of the market-weighted methodology: The market-weighted methodology results in an index which presents a more representative picture of the overall economy than indices that assign an equal share to all companies or are price-weighted.

Drawbacks of the market-weighted methodology: The market-weighted methodology results in the mega-cap companies impacting the index in an outsized manner. Furthermore, this methodology hides the weaknesses and/or strengths of smaller companies if their performance diverges from the performance of the large-cap companies.

How to Invest in Standard and Poor’s index?

It is difficult for investors to replicate the S&P 500 because a portfolio based on that index requires specific quantities of stock from 500 companies. It is easier to buy an index fund if an investor wishes to replicate the index. Popular index funds include:

  • Vanguard S&P 500 ETF
  • iShares S&P 500 Index ETF
  • SPDR S&P 500 ETF

To learn more, launch our free finance courses!

Other S&P indices

Other popular Standard & Poor’s indices include:

  • SmallCap 600: An index representing small-cap companies
  • MidCap 400: An index representing mid-cap companies
  • 900: Combines 500 and MidCap 400
  • Composite 1500: SmallCap 600, MidCap 400, and 500 are combined. They are then collectively calculated to arrive at the Composite 1500.

3. S&P Global Market Intelligence

S&P Global Market Intelligence provides high-quality industry data, financial data, news, analysis, and research to its client investors based on the client’s portfolio. Its clients include universities, corporations, government agencies, and investment professionals. The tools they provide help their clients:

  • Track the performance of their portfolios
  • Track the performance of certain sectors of the economy
  • Generate alpha
  • Understand industry dynamics
  • Find investment opportunities
  • Assess credit risk

To learn more, launch our free finance courses!

4. S&P Global Platts

S&P Global Platts was founded in 1909 and provides benchmark prices for, and information about, the energy and commodities markets. The segments covered by them include power, oil and gas, petrochemicals, agriculture, shipping, and metals. Their clients include:

  • Traders
  • Risk managers
  • Analysts
  • Purchasing agents
  • Exploration companies
  • Refiners
  • Miners
  • Utilities
  • Steel companies
  • Airlines
  • Auto manufacturers
  • Government agencies
  • Financial institutions
  • Lawyers
  • Engineers
  • Consultants
  • Asset managers


Learn More

Thank you for reading CFI’s guide on S&P – Standard and Poor’s. Find out more about equity investing by clicking on the following CFI articles:

0 search results for ‘