Get Certified for
Business Intelligence (BIDA®)
Develop analytical superpowers by learning how to use programming and data analytics tools such as VBA, Python, Tableau, Power BI, Power Query, and more.
An estimate of an interval in statistics that may contain a population parameter
A confidence interval is an estimate of an interval in statistics that may contain a population parameter. The unknown population parameter is found through a sample parameter calculated from the sampled data. For example, the population mean μ is found using the sample mean x̅.
The interval is generally defined by its lower and upper bounds. The confidence interval is expressed as a percentage (the most frequently quoted percentages are 90%, 95%, and 99%). The percentage reflects the confidence level.

The concept of the confidence interval is very important in statistics (hypothesis testing) since it is used as a measure of uncertainty. The concept was introduced by Polish mathematician and statistician, Jerzy Neyman in 1937.
The proper interpretation of a confidence interval is probably the most challenging aspect of this statistical concept. One example of the most common interpretation of the concept is the following:
There is a 95% probability that, in the future, the true value of the population parameter (e.g., mean) will fall within X [lower bound] and Y [upper bound] interval.
In addition, we may interpret the confidence interval using the statement below:
We are 95% confident that the interval between X [lower bound] and Y [upper bound] contains the true value of the population parameter.
However, it would be inappropriate to state the following:
There is a 95% probability that the interval between X [lower bound] and Y [upper bound] contains the true value of the population parameter.
The statement above is the most common misconception about confidence interval. After the statistical interval is calculated, the interval can only either contain the population parameter or not. Nevertheless, the intervals may vary among the samples, while the true population parameter is the same regardless of the sample.
Therefore, the probability statement regarding the confidence interval can be made in the case when the confidence intervals are recalculated for the number of samples.
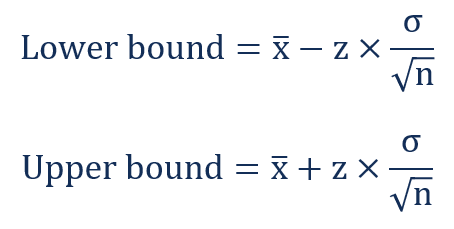
The interval is calculated using the following steps:
a. Known population standard deviation
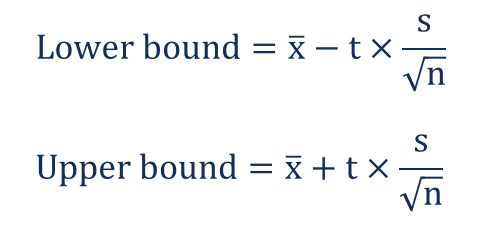
b. Unknown population standard deviation
CFI is the official provider of the Business Intelligence & Data Analyst (BIDA)® certification program, designed to transform anyone into a world-class financial analyst.
To keep learning and developing your knowledge of financial analysis, we highly recommend the additional CFI resources below:


