Get Certified for Financial Modeling (FMVA)®
Gain in-demand industry knowledge and hands-on practice that will help you stand out from the competition and become a world-class financial analyst.
EBITDA (Earnings Before Interest, Tax, Depreciation, and Amortization) is a financial metric used to evaluate a company’s core profitability from operations by excluding the effects of financing and non-cash accounting items.
EBITDA stands for Earnings Before Interest, Taxes, Depreciation, and Amortization and is a financial metric used to evaluate a company’s operating performance. It removes the effects of financing and certain accounting decisions, giving a clearer view of operational performance.
In simple terms, EBITDA reflects a company’s ability to generate earnings from its operations alone. It removes the impact of financing choices, tax environments, and accounting policies, offering a clearer picture of core operational performance.
The EBITDA metric is a variation of operating income (EBIT) that excludes certain non-cash and non-operating expenses. These include interest (tied to capital structure), taxes (dependent on jurisdiction), and depreciation and amortization (based on historical investments and accounting methods).
Because of these adjustments, EBITDA helps analysts compare profitability across companies with different capital structures or tax strategies. However, it’s not a standardized GAAP or IFRS metric. Critics — such as Warren Buffett — caution against relying too heavily on EBITDA because it ignores critical costs like depreciation, which reflect the true wear and tear on a company’s assets.
For example, companies with significant capital assets will show higher EBITDA by excluding large depreciation expenses, yet those assets still require eventual replacement.
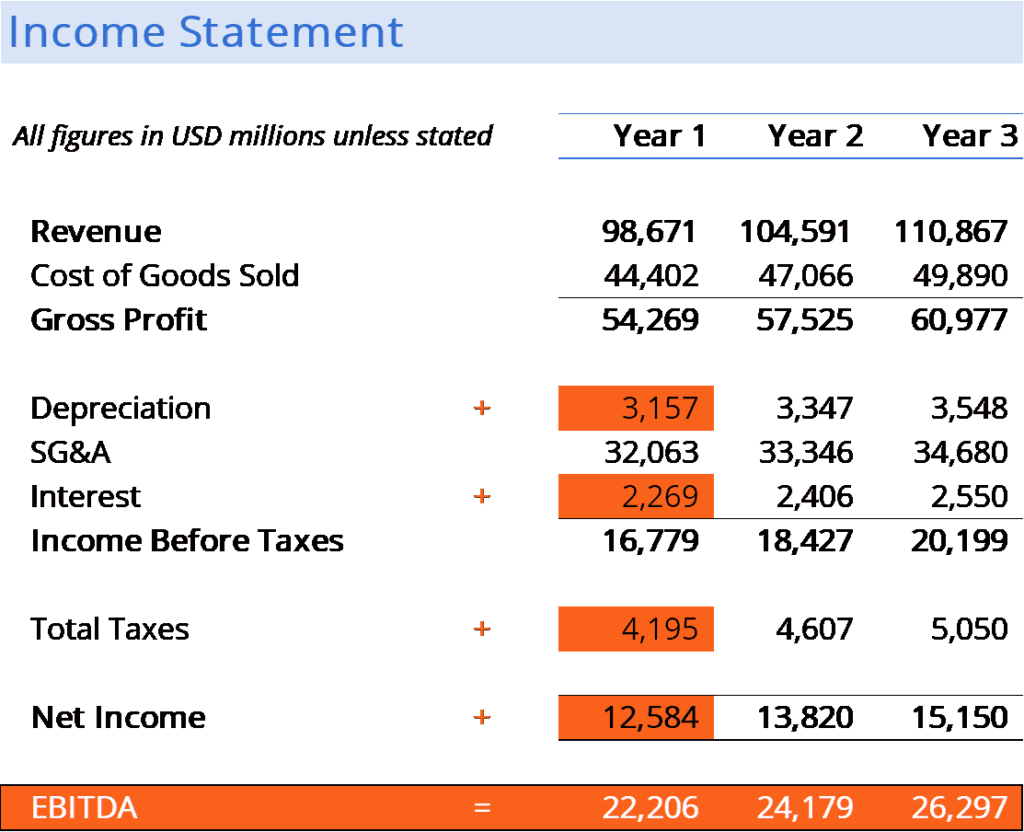
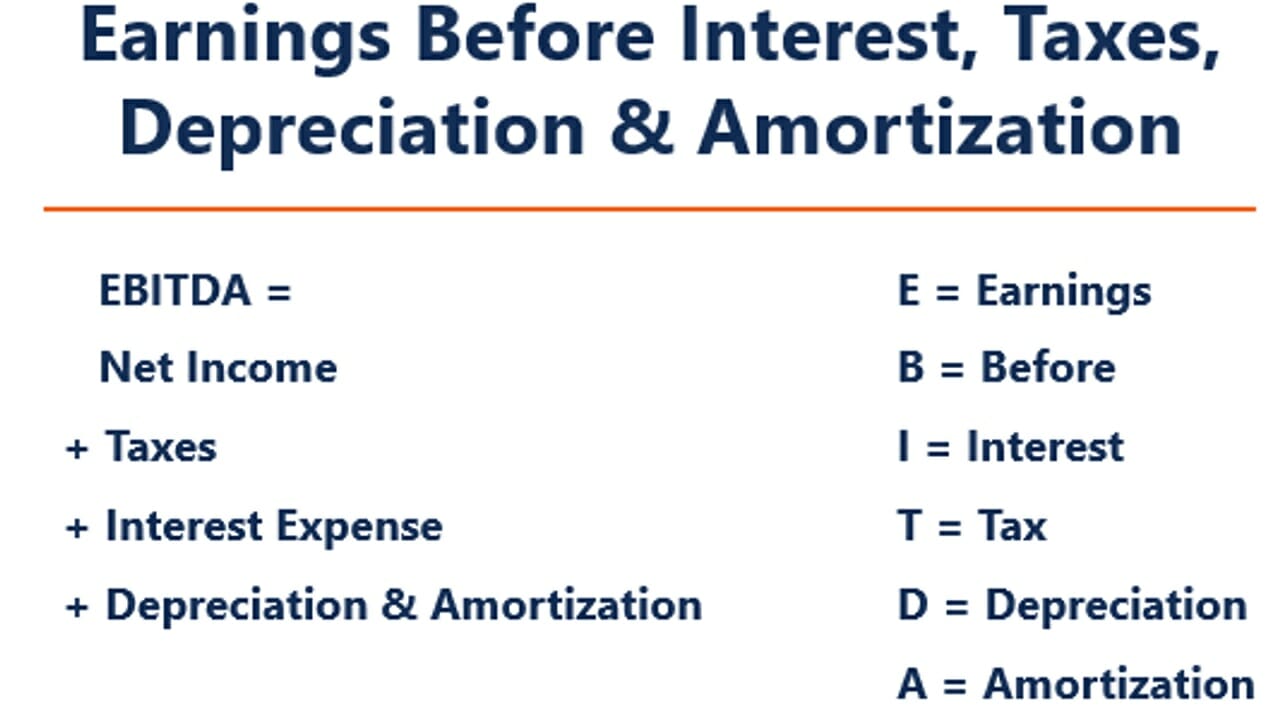
The EBITDA formula is used to calculate a company’s earnings before the impact of financing and certain accounting decisions. This provides a standardized view of its operational profitability. Here is the formula for calculating EBITDA:
EBITDA = Net Income + Interest + Taxes + Depreciation + Amortization
or
EBITDA = Operating Profit + Depreciation + Amortization
Each element of the EBITDA formula tells part of the story. Below, we break down the meaning and relevance of each component of EBITDA:
Interest expense is excluded from EBITDA, as this expense depends on the financing structure of a company. Interest expense comes from the money a company has borrowed to fund its business activities.
Different companies have different capital structures, resulting in different interest expenses. Hence, it is easier to compare the relative performance of companies by adding back interest and ignoring the impact of capital structure on the business. Note that interest payments are tax-deductible, meaning corporations can take advantage of this benefit in what is called a corporate tax shield.
Taxes vary and depend on the region where the business is operating. They are a function of a jurisdiction’s tax rules, which are not really part of assessing a management team’s performance, and, thus, many financial analysts prefer to add them back when comparing businesses.
Depreciation and amortization (D&A) depend on the historical investments the company has made and not on the current operating performance of the business. Companies invest in long-term fixed assets (such as buildings or vehicles) that lose value due to wear and tear.
The depreciation expense is based on a portion of the company’s tangible fixed assets deteriorating over time. Amortization expense is incurred if the asset is intangible. Intangible assets, such as patents, are amortized because they have a limited useful life (competitive protection) before expiration.
D&A is heavily influenced by assumptions regarding useful economic life, salvage value, and the depreciation method used. Because of this, analysts may find that operating income is different than what they think the number should be, and therefore, D&A is added back to EBIT to calculate EBITDA.
The D&A expense can be located in the firm’s cash flow statement under the cash from operating activities section. Since depreciation and amortization are non-cash expenses, both are added back to net income on the cash flow statement (the expense on the cash flow statement is usually a positive number for this reason).

Example: The depreciation and amortization expense for Company XYZ is $12,000.
Investors and analysts sometimes use EBITDA as a rough proxy for profit from operations or as a starting point for cash flow analysis. It can provide a cleaner lens into a company’s operational profitability, especially when comparing peers with different capital expenditures, tax burdens, or financing decisions.
Key uses include:
Many private equity firms and investment analysts prefer EBITDA because it highlights the earnings a company generates from its core business, without noise from financing or accounting policies.
In addition, when a company is not making a net profit, investors can turn to EBITDA to evaluate a company. Many private equity firms use this metric because it is very good for comparing similar companies in the same industry. Finance teams use it to compare their company’s performance against their competitors.
While EBITDA is a useful metric, it has clear limitations:
We advise using EBITDA alongside other financial metrics like net income and cash flow to assess a company’s profitability and cash position.
The EV/EBITDA ratio (Enterprise Value to EBITDA) is widely used in business valuation. It helps investors assess whether a company is overvalued (high ratio) or undervalued (low ratio) relative to peers. A company’s EV/EBITDA ratio is found by dividing its enterprise value by its EBITDA.
It’s important to compare companies that are similar in nature (same industry, operations, customers, margins, growth rate, etc.), as different industries have vastly different average ratios (high ratios for high-growth industries, low ratios for low-growth industries).
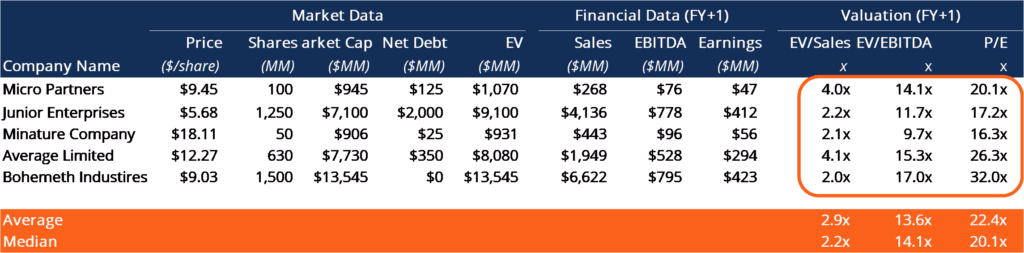
Company ABC and Company XYZ are competing grocery stores that operate in New York. ABC has an enterprise value of $200mm and an EBITDA of $10mm, while firm XYZ has an enterprise value of $300mm and an EBITDA of $30mm. Which company is undervalued on an EV/EBITDA basis?
| Company | Enterprise Value | EBITDA | EV/EBITDA |
| ABC | $200mm | $10mm | 20x |
| XYZ | $300mm | $30mm | 10x |
On an EV/EBITDA basis, Company XYZ, with the lower EV/EBITDA ratio, may be considered more attractively priced, assuming similar growth and risk profiles between the two companies.
EBITDA is used frequently in financial modeling as a starting point for calculating unlevered free cash flow. EBITDA is such a frequently referenced metric in finance that it’s helpful to use it as a reference point, even though a discounted cash flow (DCF) model only values the business based on its free cash flow.
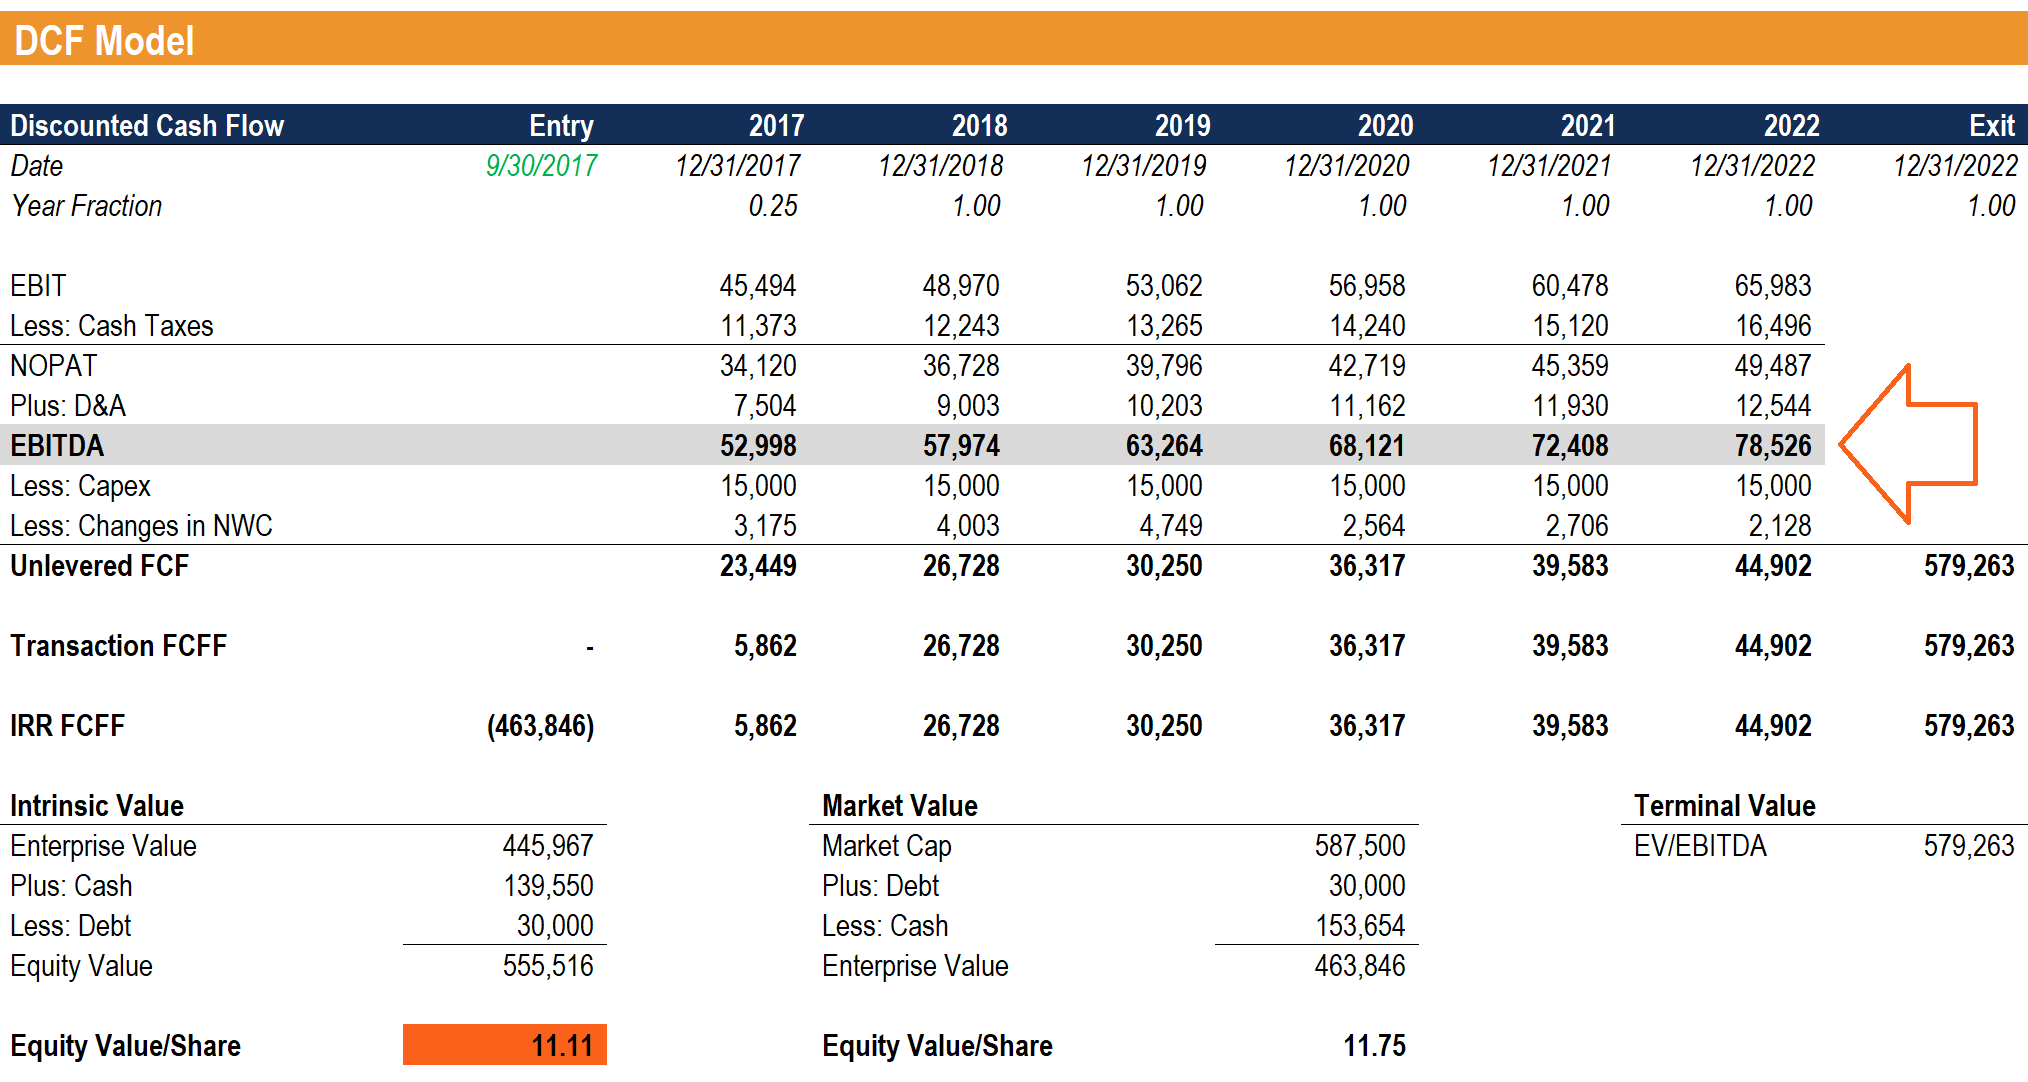
Image: CFI’s Financial Modeling courses
Company XYZ accounts for its $12,000 depreciation and amortization expense as part of its operating expenses. Calculate its Earnings Before Interest, Taxes, Depreciation, and Amortization:

EBITDA = Net Income + Tax Expense + Interest Expense + Depreciation & Amortization Expense
EBITDA = $19,000 + $2,000 + $19,000 + $12,000 = $52,000
Alternative Method:
EBITDA = Revenue – Cost of Goods Sold – Operating Expenses + Depreciation & Amortization Expense
EBITDA = $82,000 – $23,000 – $19,000 + $12,000 = $52,000
Company XYZ’s depreciation and amortization expenses are incurred from using its machine that packages the candy the company sells. It has $40,000 in debt, pays 5% interest to debtholders, and has a tax rate of 50%.
What is XYZ’s Earnings Before Interest, Taxes, Depreciation, and Amortization?
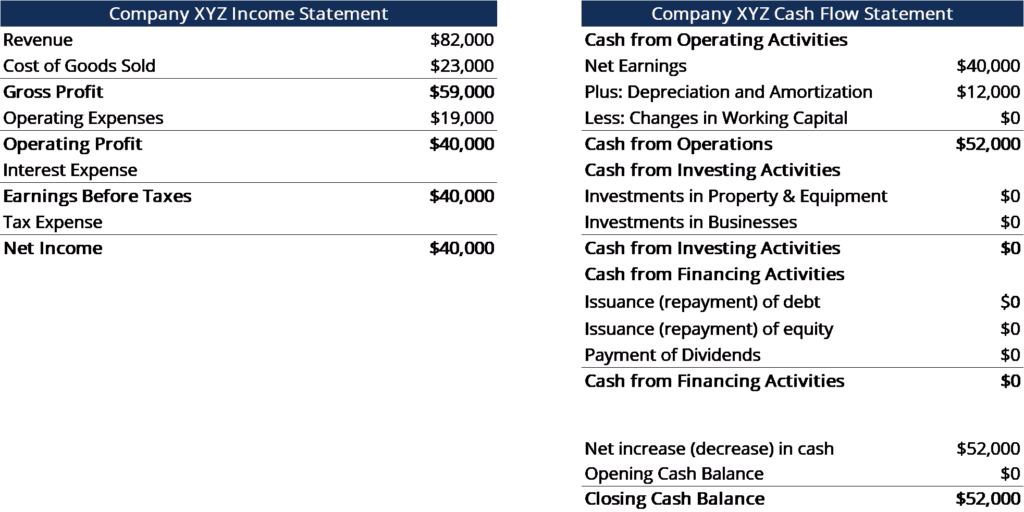
In the Statement of Cash Flows, the expense is listed as $12,000.
Since the expense is attributed to the machines that package the company’s candy (the depreciating asset directly helps with producing inventory), the expense will be a part of their cost of goods sold (COGS).
EBITDA = Net Income + Tax Expense + Interest Expense + Depreciation & Amortization Expense
= $19,000 + $19,000 + $2,000 + $12,000
= $52,000
OR
EBITDA = Revenue – Cost of Goods Sold – Operating Expenses + Depreciation & Amortization Expense
= $82,000 – $23,000 – $19,000 + $12,000
= $52,000
Download CFI’s free Excel template now to advance your finance knowledge and perform better financial analysis.
NTM EBITDA refers to projected earnings before interest, taxes, depreciation, and amortization for the upcoming 12 months.
Financial analysts use NTM EBITDA in several forward-looking multiples when evaluating comparable peers, potential M&A targets, and leveraged buyouts (LBO) deals. This metric is especially useful when assessing a business that is undergoing major changes or a growth company that has not yet posted steady profits.
NTM EBITDA must be built from projections rather than historical performance data. That means you’ll need to rely on forward-looking inputs from company guidance, analyst estimates, or your own model.
Here’s how to approach the calculation:
Start with the best available data. If you have quarterly revenue estimates from analysts, sum the next four quarters. If it is mid-year and only annual estimates are available, blend the remaining part of this year with the start of next year. Be sure to adjust for seasonality, upcoming product launches, or business shifts.
Look at recent EBITDA margins as a starting point, but don’t stop there. Factor in expectations for changes in operating leverage, input costs, or economies of scale. Margin projections should reflect the business environment as well as internal developments.
Once you’ve forecasted revenue and EBITDA margin, you’re ready to calculate NTM EBITDA using a straightforward formula.
The formula for NTM EBITDA is:
Let’s walk through a quick example calculation.
A growing SaaS company projects $50 million in revenue over the next 12 months and assumes a 20% EBITDA margin during that period.
Using the formula above, you calculate NTM EBITDA as follows:
NTM EBITDA = 20% × $50mm = $10mm
The resulting $10 million becomes your EBITDA projection for the company in the next 12 months.
Unlike LTM EBITDA (last twelve months), which reflects past performance, NTM EBITDA focuses on expected future earnings. This forward-looking EBITDA metric is particularly helpful when valuing businesses that are preparing to scale, restructure, or undergo significant changes.
In practical terms, NTM EBITDA is often used in valuation multiples, such as EV/EBITDA, to compare companies across peers or time periods. Using NTM EBITDA allows analysts to normalize for timing differences and better reflect expected performance.
Therefore, NTM EBITDA serves as a useful (though imperfect) starting point to forecast cash flow in forward-looking models.
You’ll often see NTM EBITDA used in:
NTM EBITDA relies on forward-looking inputs, so even small assumptions or changes can make a big impact. Before you finalize your analysis, ask yourself:
These questions help stress-test your inputs. The more disciplined your approach, the more reliable your valuation will be.
Connect what you just learned to a clear career path with CFI’s role‑based courses and certification programs.
If you are looking for a career in corporate finance, this is a metric you’ll hear a lot about. To keep learning more, we highly recommend these additional CFI resources:


