Get Certified for Financial Modeling (FMVA)®
Gain in-demand industry knowledge and hands-on practice that will help you stand out from the competition and become a world-class financial analyst.
A balance sheet is a key financial statement that reports a company’s financial position at a specific point in time.
A balance sheet provides a snapshot of what a company owns (assets), what it owes (liabilities), and the value left for the owners (shareholders’ equity).
Also called a statement of financial position, the balance sheet is structured around the accounting equation:
The balance sheet must always balance, meaning assets are always equal to the sum of liabilities and equity. As one of the three core financial statements, the balance sheet is used to assess a company’s financial strength, liquidity, and capital structure.
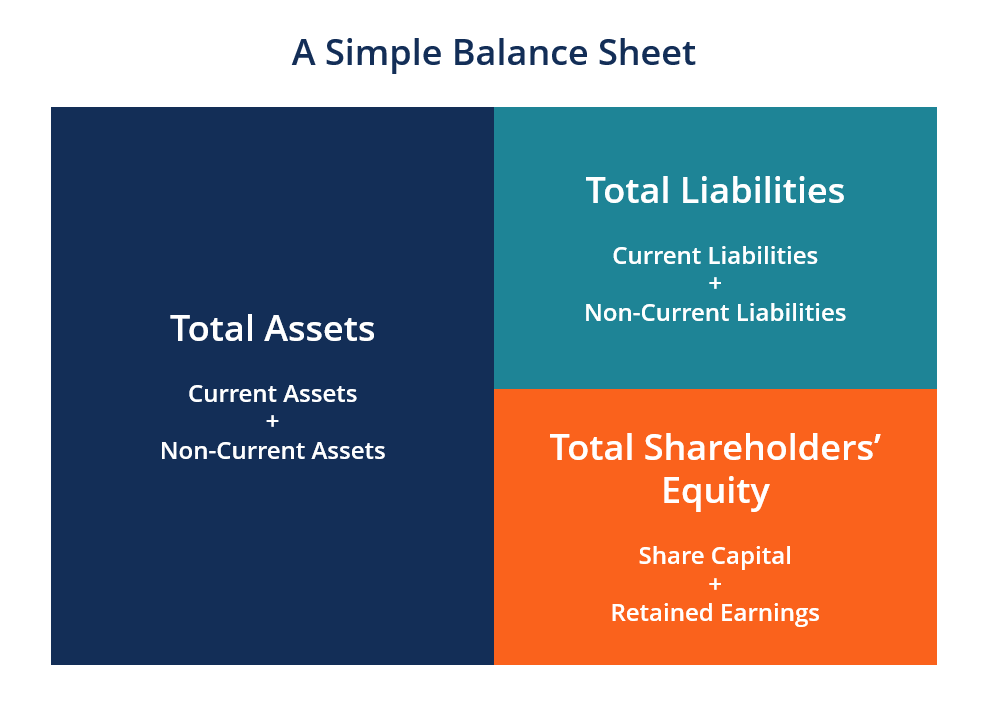
Image: CFI’s Financial Analysis Fundamentals Course
The balance sheet is divided into two sides (or sections). The left side of the balance sheet outlines the company’s assets. On the right side, the balance sheet outlines the company’s liabilities and shareholders’ equity.
The assets and liabilities are separated into two categories: current assets/liabilities and non-current (long-term) assets/liabilities. More liquid accounts, such as Inventory, Cash, and Trades Payables, are placed in the current section before illiquid accounts (or non-current) such as Plant, Property, and Equipment (PP&E) and Long-Term Debt.
Below is an example of Amazon’s balance sheet taken from its 2024 annual report and Form 10-K filing. Note how the balance sheet starts with current assets at the top, followed by non-current assets, then total assets. Beneath total assets, we find liabilities and stockholders’ equity, which includes current liabilities, non-current liabilities, and finally shareholders’ equity.
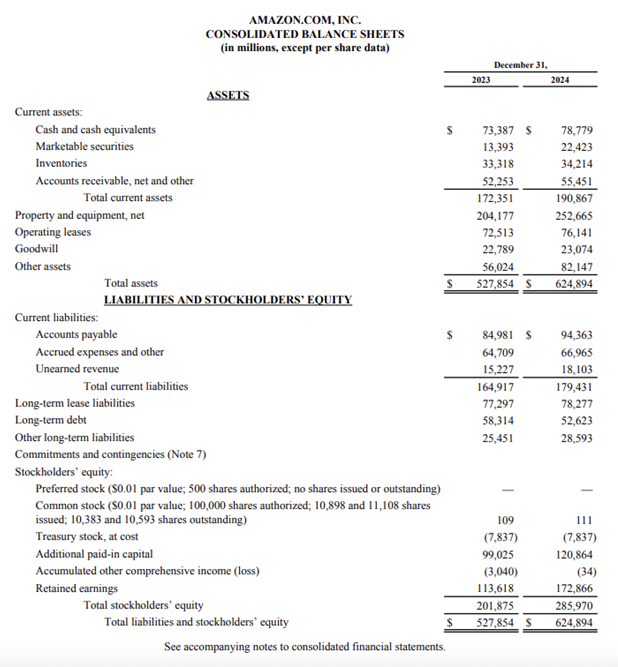
View Amazon’s investor relations website to access the full balance sheet and annual report.
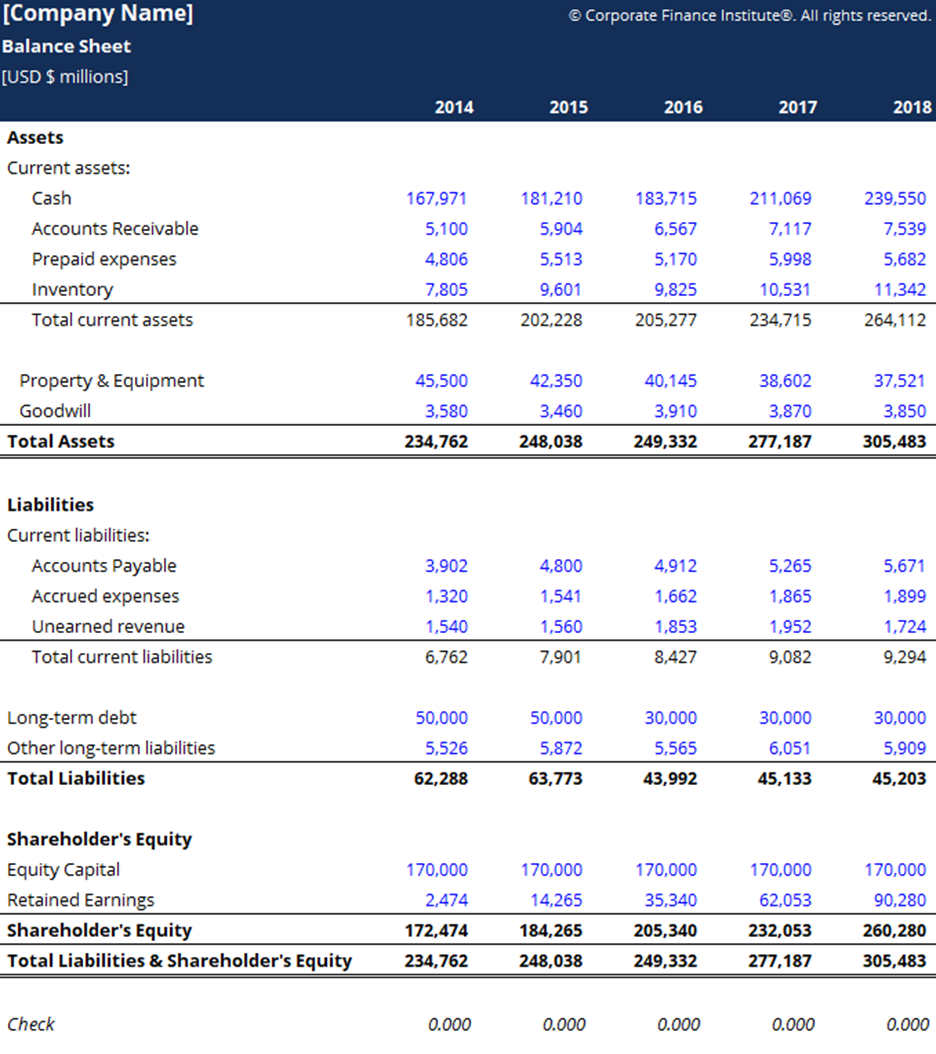
You can download CFI’s free balance sheet template in Excel to input figures for any company and see how a balance sheet works in real time.
Balance sheets, like all financial statements, will have minor differences between organizations and industries. However, there are several “buckets” and line items that are almost always included in common balance sheets. We briefly go through commonly found line items under Current Assets, Long-Term Assets, Current Liabilities, Long-Term Liabilities, and Equity.
The most liquid of all assets, cash, usually appears on the first line of the balance sheet. Cash Equivalents are also lumped under this line item and include assets that have short-term maturities under three months or assets that the company can liquidate on short notice, such as marketable securities. Companies will generally disclose what equivalents they include in the footnotes to the balance sheet.
This account includes the balance of all sales revenue still on credit, net of any allowances for doubtful accounts (which generates a bad debt expense). As companies recover accounts receivables, this account decreases, and cash increases by the same amount.
Inventory includes amounts for raw materials, work-in-progress goods, and finished goods. The company uses this account when it reports sales of goods, generally under cost of goods sold in the income statement.
Property, Plant, and Equipment (also known as PP&E) captures the company’s tangible fixed assets. The line item is noted net of accumulated depreciation. Some companies will classify their PP&E by the different types of assets, such as Land, Building, and various types of Equipment. All PP&E is depreciable, except for Land.
This line item includes all of the company’s intangible assets, which may or may not be identifiable. Identifiable intangible assets include patents, licenses, and secret formulas. Unidentifiable intangible assets include brand and goodwill.
Accounts Payables, or AP, is the amount a company owes suppliers for items or services purchased on credit. As the company pays off its AP, it decreases by an equal amount in the cash account.
Includes non-AP obligations that are due within one year’s time or within one operating cycle for the company (whichever is longest). Notes payable may also have a long-term version, which includes notes with a maturity of more than one year.
This account may or may not be lumped together with the above account, Current Debt. While they may seem similar, the current portion of long-term debt is specifically the portion due within this year of a piece of debt that has a maturity of more than one year.
For example, if a company takes on a bank loan to be paid off in 5 years, this account will include the portion of that loan due in the next year.
This account includes the amortized amount of any bonds the company has issued.
This account includes the total amount of long-term debt (excluding the current portion, if that account is present under current liabilities). This account is derived from the debt schedule, which outlines all of the company’s outstanding debt, the interest expense, and the principal repayment for every period.
This is the value of funds that shareholders have invested in the company. When a company is first formed, shareholders will typically put in cash. For example, an investor starts a company and seeds it with $10M. Cash (an asset) rises by $10M and Share Capital (an equity account) rises by $10M, balancing out the balance sheet.
This is the total amount of net income the company decides to keep. Every period, a company may pay out dividends from its net income. Any amount remaining (or exceeding) is added to (deducted from) retained earnings.
The balance sheet plays a key role in financial modeling and analysis. It helps analysts:
For example, a positive change in plant, property, and equipment is equal to capital expenditure minus depreciation expense. If depreciation expense is known, capital expenditure can be calculated and included as a cash outflow under cash flow from investing in the cash flow statement.
Image: CFI’s Financial Analysis Fundamentals Course
The balance sheet helps you evaluate a company’s financial stability, compare performance with peers, and assess how efficiently the business manages its resources. It also supports deeper analysis when used together with the income statement and cash flow statement.
To interpret a balance sheet effectively, analysts often use financial ratios that link balance sheet data to company performance. Four common categories include:
All of the above ratios and metrics are covered in detail in CFI’s Financial Analysis Fundamentals course. Connect what you just learned to a clear career path with CFI’s role‑based courses and certification programs.
A balance sheet is a financial statement that shows what a company owns, what it owes, and the value left for owners at a specific date, giving you a quick snapshot of the company’s financial position.
A balance sheet tells you how strong or stretched a company’s finances are. It shows whether assets can cover debts, how much the business relies on borrowing, and how much value belongs to shareholders. Balance sheets help you assess a company’s financial health, stability, and capacity to handle current and future obligations like debt.
A balance sheet helps you understand a company’s financial position at a single point in time. Its purpose is to show what the business owns, what it owes, and the value of owners’ equity. This helps investors, lenders, and leaders assess performance, funding needs, and overall financial strength.
A balance sheet follows a simple format with three sections: assets, liabilities, and shareholders’ equity. Assets appear first, typically organized by liquidity. Liabilities usually list obligations in order of when they’re due. Equity shows owners’ claims. The format follows the accounting equation: assets equal liabilities plus equity.
To continue learning and advancing your career as a financial analyst, these additional CFI resources will be helpful:


