Get Certified for Financial Modeling (FMVA)®
Gain in-demand industry knowledge and hands-on practice that will help you stand out from the competition and become a world-class financial analyst.
Income, expenses, and profit/loss
The Income Statement is one of a company’s core financial statements that shows their profit and loss over a period of time. It summarizes all revenues and expenses from both operating and non-operating activities to show the company’s profit or loss for the period.
In both corporate finance (including financial modeling) and accounting, the income statement displays the company’s revenue, costs, gross profit, selling and administrative expenses, other expenses and income, taxes paid, and net profit in a coherent and logical manner.

Image: CFI’s Free Accounting Fundamentals Course.
The statement is divided into time periods that logically follow the company’s operations. The most common periodic division is monthly (for internal reporting), although certain companies may use a thirteen-period cycle. These periodic statements are aggregated into total values for quarterly and annual results.
This statement is a great place to begin a financial model, as it requires the least amount of information from the balance sheet and cash flow statement. Thus, in terms of information, the income statement often serves as the starting point before incorporating the balance sheet and cash flow statement into a full financial model.
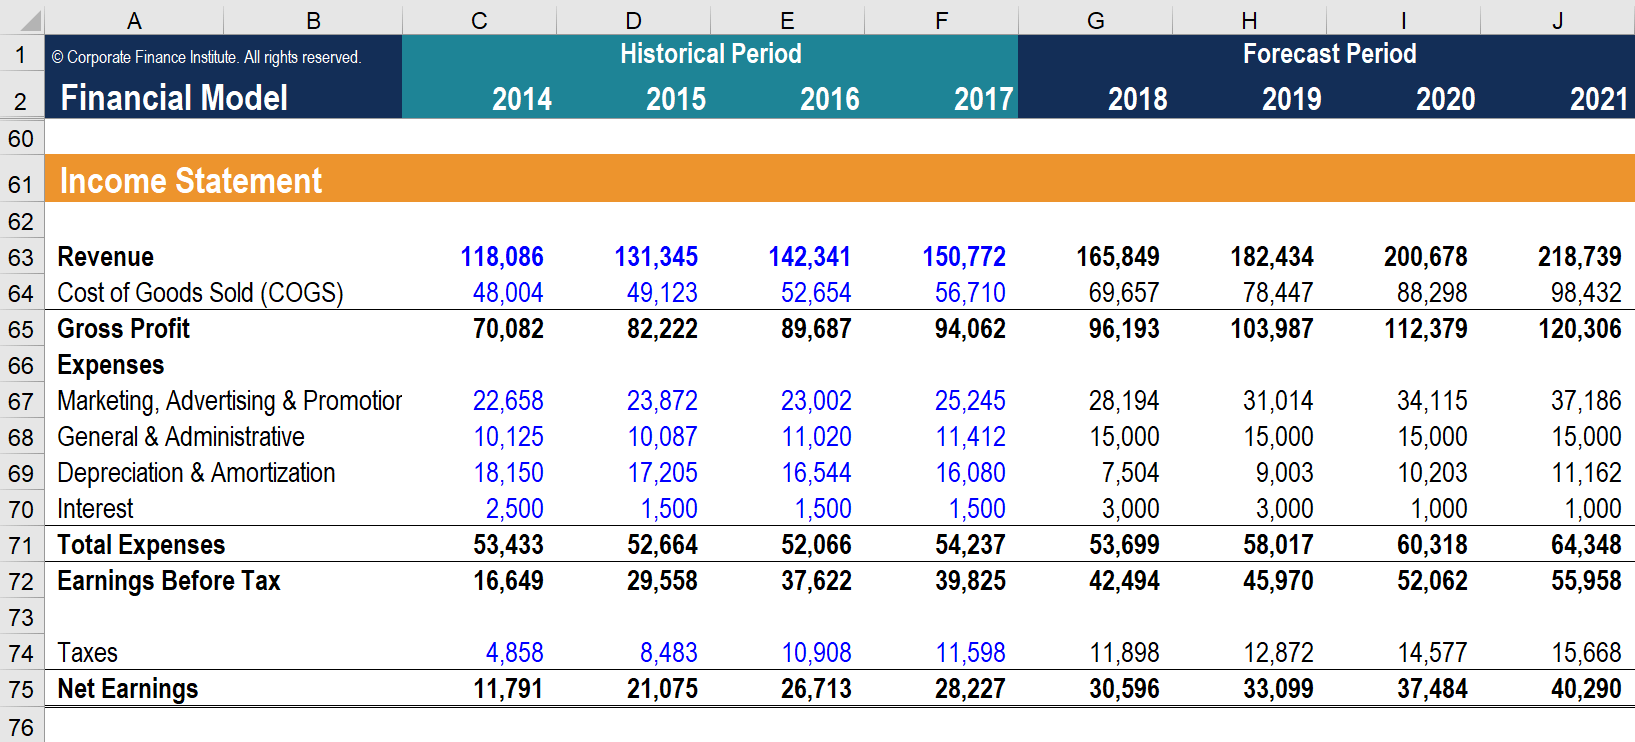
Image: CFI’s Financial Modeling Courses.
Click the button below to download our free Income Statement template!
The income statement may have minor variations between different companies, as expenses and income will be dependent on the type of operations or business conducted. However, there are several generic line items that are commonly seen in any basic income statement.
The most common income statement items include:
Sales Revenue is the company’s revenue from sales or services, displayed at the very top of the statement. This value will be the gross of the costs associated with creating the goods sold or in providing services. Some companies have multiple revenue streams that add to a total revenue line.
Cost of Goods Sold (COGS) is a line-item that aggregates the direct costs associated with selling products to generate revenue. This line item can also be called Cost of Sales if the company is a service business. Direct costs can include labor, parts, materials, and an allocation of other expenses such as depreciation (see an explanation of depreciation below).
Gross Profit Gross profit is calculated by subtracting Cost of Goods Sold (or Cost of Sales) from Sales Revenue.
Most businesses have some expenses related to selling goods and/or services. Marketing, advertising, and promotion expenses are often grouped together as they are similar expenses, all related to selling.
SG&A Expenses include the selling, general, and administrative section that contains all other indirect costs associated with running the business. This includes salaries and wages, rent and office expenses, insurance, travel expenses, and sometimes depreciation and amortization, along with other operational expenses. Entities may, however, elect to separate depreciation and amortization in their own section.
While not present in all income statements, EBITDA stands for Earnings before Interest, Tax, Depreciation, and Amortization. It is calculated by subtracting SG&A expenses (excluding amortization and depreciation) from gross profit.
Depreciation and amortization are non-cash expenses that are created by accountants to spread out the cost of capital assets such as Property, Plant, and Equipment (PP&E).
Operating Income represents what’s earned from regular business operations. In other words, it’s the profit before any non-operating income, non-operating expenses, interest, or taxes are subtracted from revenues. EBIT is a term commonly used in finance and stands for Earnings Before Interest and Taxes.
Interest Expense. It is common for companies to split out interest expense and interest income as a separate line item in the income statement. This is done in order to reconcile the difference between EBIT and EBT. Interest expense is determined by the debt schedule.
Businesses often have other expenses that are unique to their industry. Other expenses may include fulfillment, technology, research and development (R&D), stock-based compensation (SBC), impairment charges, gains/losses on the sale of investments, foreign exchange impacts, and many other expenses that are industry or company-specific.
EBT stands for Earnings Before Tax, also known as pre-tax income, and is found by subtracting interest expense from Operating Income. This is the final subtotal before arriving at net income.
Income Taxes refer to the relevant taxes charged on pre-tax income. The total tax expense can consist of both current taxes and future taxes.
Net Income is calculated by deducting income taxes from pre-tax income. This is the amount that flows into retained earnings on the balance sheet, after deductions for any dividends.
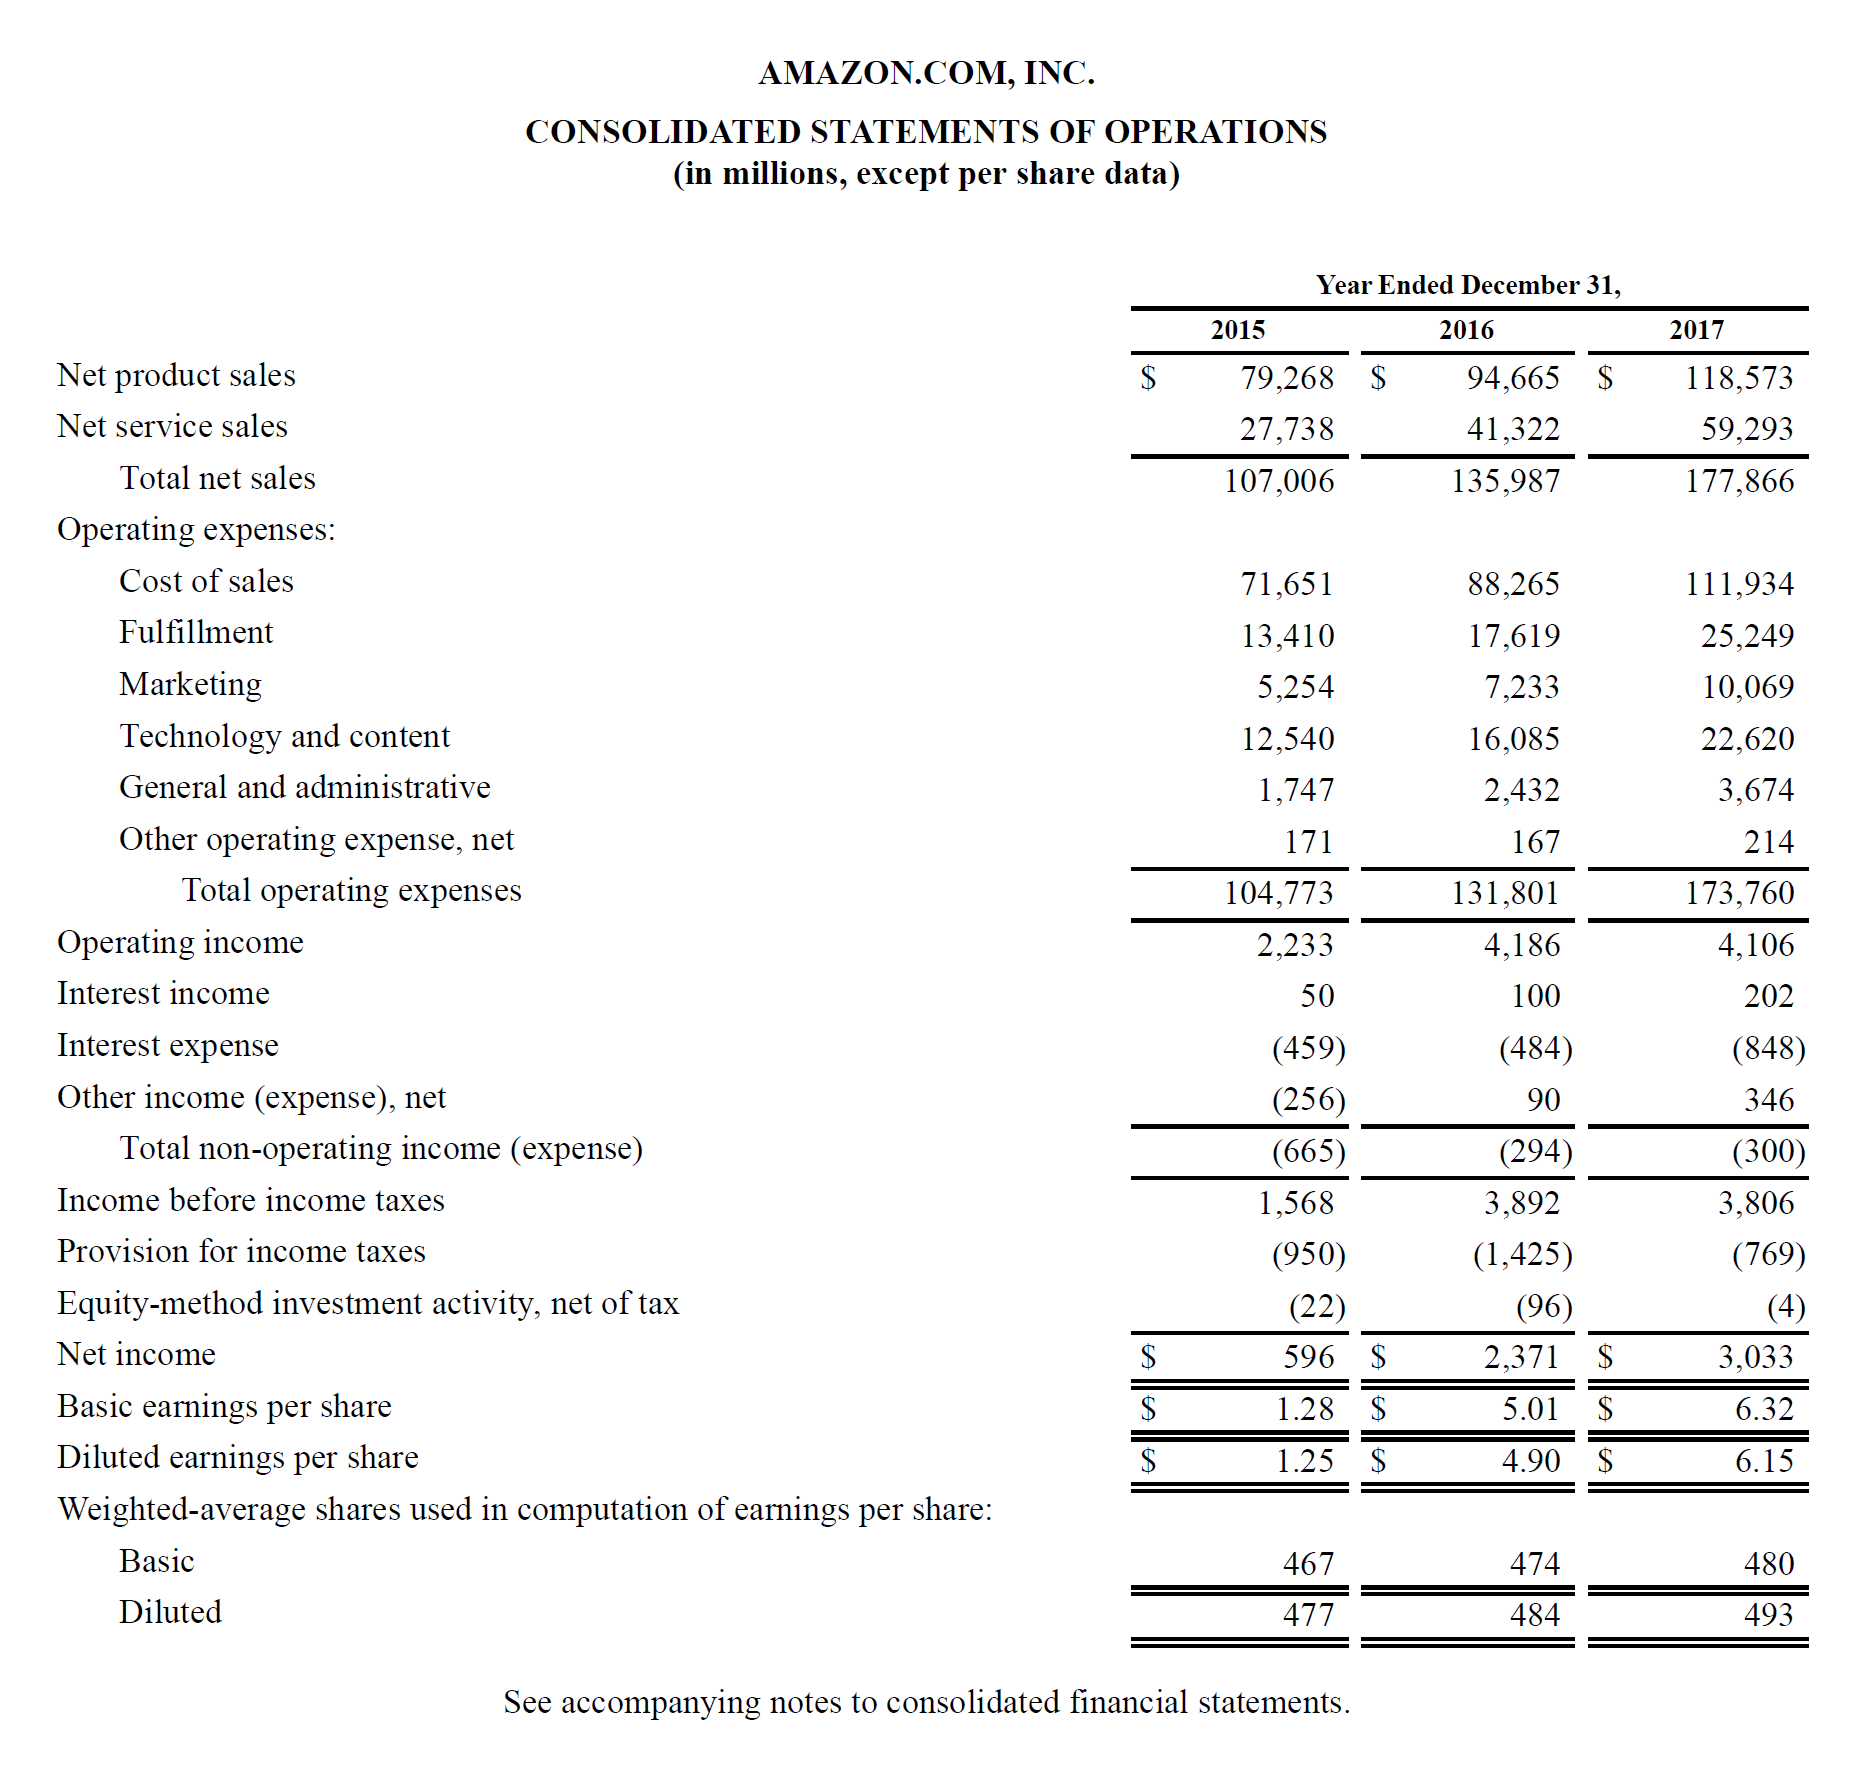
Below is an example of Amazon’s consolidated statement of operations, or income statement, for the years ended December 31, 2015 – 2017. Take a look at the P&L and then read a breakdown of it below.
Learn to analyze an income statement in CFI’s Financial Analysis Fundamentals Course.
Starting at the top, we see that Amazon has two different revenue streams – products and services – which combine to form total revenue.
There is no gross profit subtotal, as the cost of sales is grouped with all other expenses, which include fulfillment, marketing, technology, content, general and administration (G&A), and other expenses.
After deducting all the above expenses, we finally arrive at the first subtotal on the income statement, Operating Income (also known as EBIT or Earnings Before Interest and Taxes).
Everything below Operating Income is not related to the ongoing operation of the business – such as non-operating expenses, provision for income taxes (i.e., future taxes), and equity-method investment activity (profits or losses from minority investments), net of tax.
Finally, we arrive at the net income (or net loss), which is then divided by the weighted average shares outstanding to determine the Earnings Per Share (EPS).
After preparing the skeleton of a basic income statement as such, it can then be integrated into a proper financial model to forecast future performance.
First, input historical data for any available time periods into the income statement template in Excel. Format historical data input using a specific format in order to be able to differentiate between hard-coded data and calculated data. As a reminder, a common method of formatting such data is to color any hard-coded input in blue while coloring calculated data or linking data in black.
Doing so enables the user and reader to know where changes in inputs can be made and which cells contain formulae and, as such, should not be changed or tampered with. Regardless of the formatting method chosen, however, remember to maintain consistent usage in order to avoid confusion.
Next, analyze the trend in the available historical data to create drivers and assumptions for future forecasting. For example, analyze the trend in sales to forecast sales growth, analyzing the COGS as a percentage of sales to forecast future COGS. Learn more about forecasting methods.
Finally, using the drivers and assumptions prepared in the previous step, forecast future values for all the line items within the income statement. Forecast specific line items, and use these to calculate subtotals. For example, for future gross profit, it is better to forecast COGS and revenue and subtract them from each other, rather than to forecast future gross profit directly.
Please download CFI’s free income statement template to produce a year-over-year income statement with your own data.
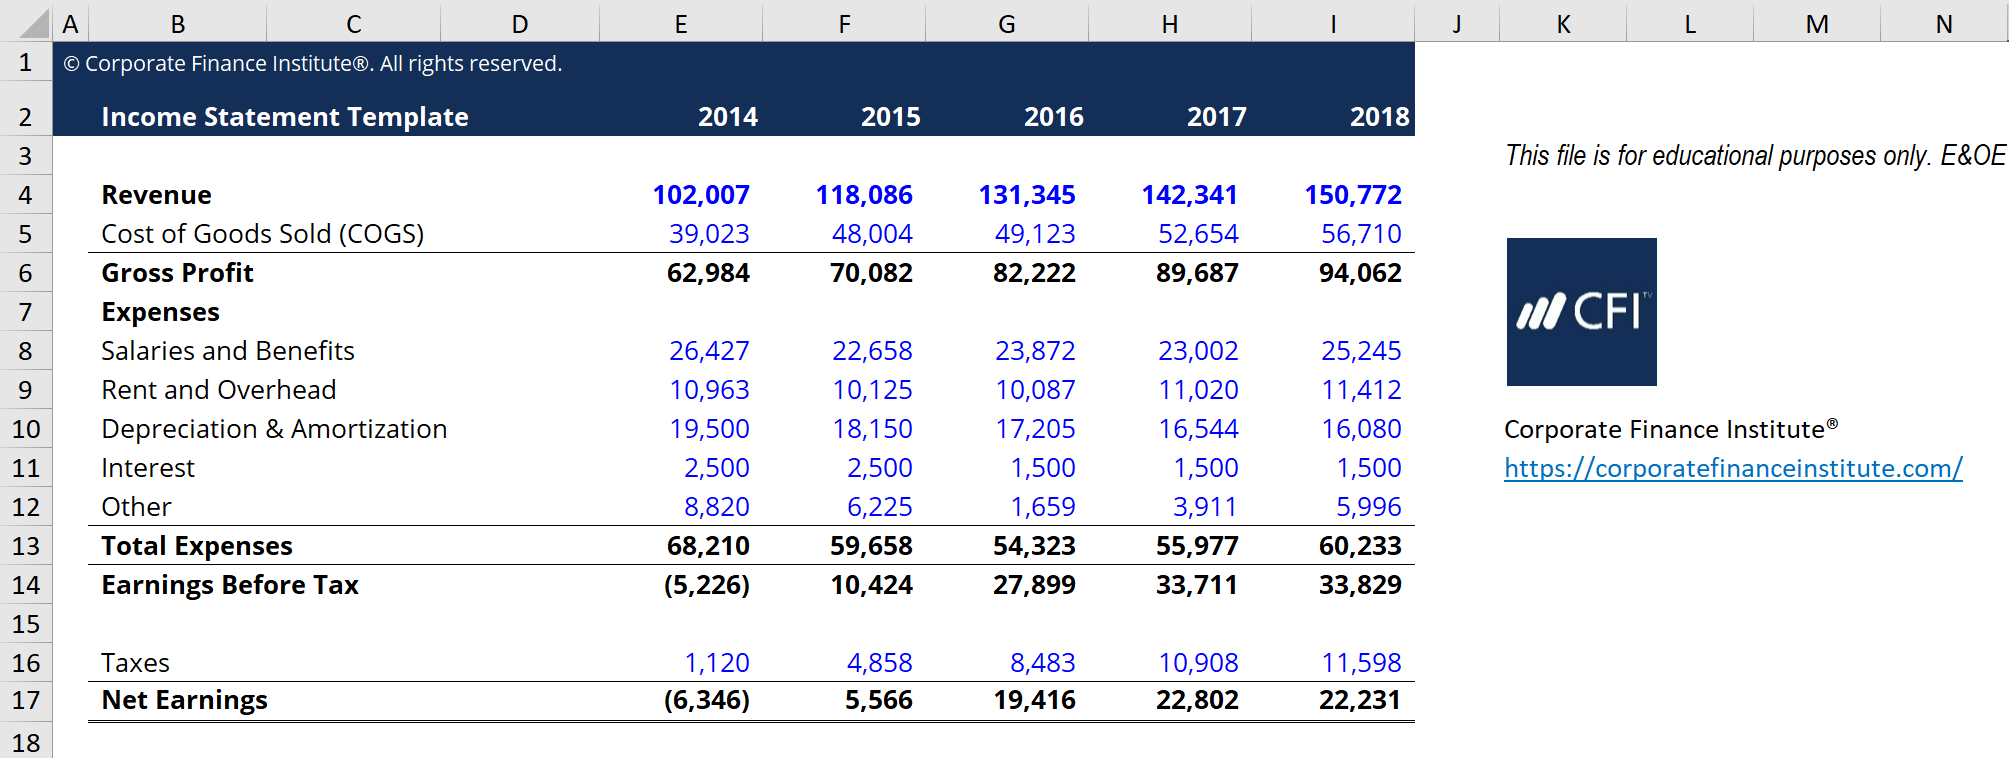
The above template is from CFI’s Financial Analysis Fundamentals Course.
| Line Item | Driver or Assumption |
|---|---|
| Sales Revenue | Selected growth percentage, pegged growth percentage based on index (such as GDP) |
| Cost of Goods Sold | Percentage of sales, Fixed dollar value |
| SG&A | Percentage of sales, fixed amount, trend, fixed dollar value |
| Depreciation and Amortization | Depreciation Schedule |
| Interest Expense | Debt Schedule |
| Income Tax | Percentage of pre-tax income (effective tax rate) |
While these drivers are commonly used, they are just general guidelines. There are situations where intuition must be exercised to determine the proper driver or assumption to use. For example, a specific entity may have zero revenue.
As such, the percentage of sales drivers cannot be used for COGS. Instead, an analyst may have to rely on examining the past trend of COGS to determine assumptions for forecasting COGS into the future.
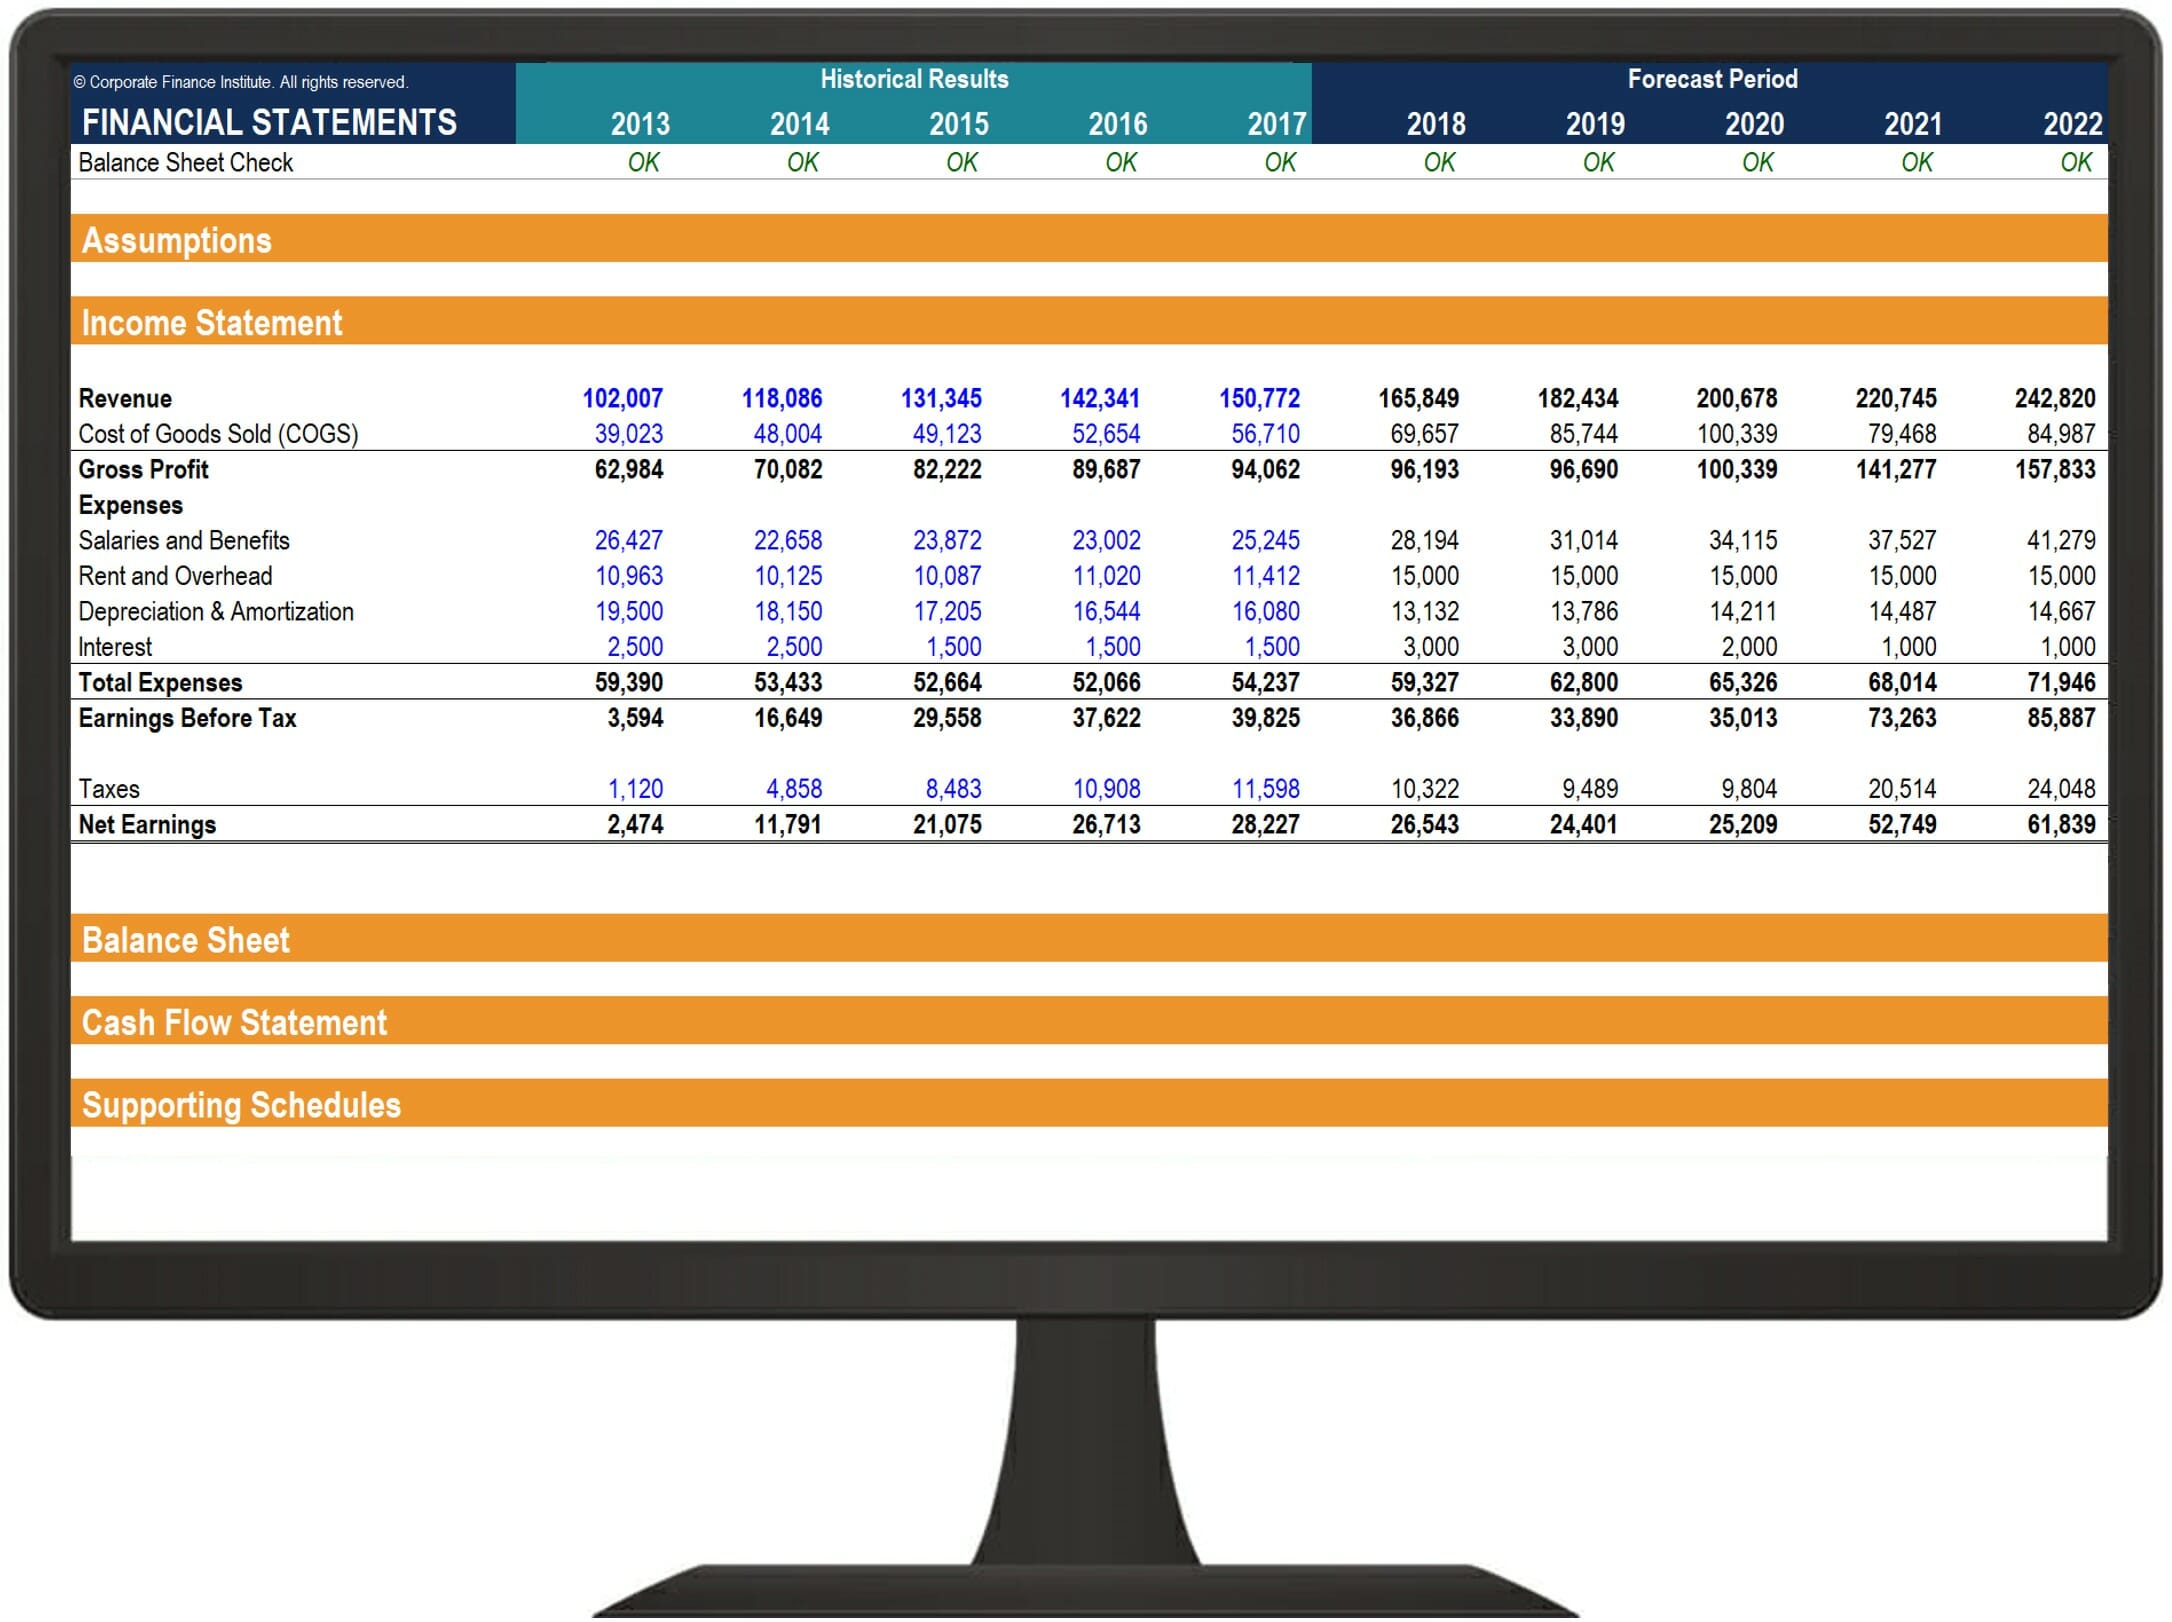
The main statements used in financial modeling are the same statements used in accounting. There are three financial statements: the Income Statement, the Balance Sheet, and the Cash Flow Statement. In a financial model, each of these statements will impact the values of the other statements.
Below is a video explanation of how the income statement works, the various items that make it up, and why it matters so much to investors and company management teams.
Connect what you just learned to a clear career path with CFI’s role‑based courses and certification programs.
Through financial modeling courses, training, and exercises, anyone in the world can become a great analyst. To keep advancing your career, the additional CFI resources below will be useful:


