Get Certified for
Capital Markets (CMSA®)
From equities and fixed income to derivatives, the CMSA certification bridges the gap from where you are now to where you want to be — a world-class capital markets analyst.
The change in demand for a good as a result of a change in the relative price of the good in terms of other goods
The substitution effect refers to the change in demand for a good as a result of a change in the relative price of the good compared to that of other substitute goods. For example, when the price of a good rises, it becomes more expensive relative to other goods in the market. As a result, consumers switch away from the good toward its substitutes.

Consider the following example: John eats rice at $5 per pound and pasta at $10 per pound. The relative price of 1 pound of pasta is 2 pounds of rice. At their current prices, John consumes 1 pound of pasta and 2 pounds of rice.
Due to technological advances in rice cultivation, rice prices have fallen from $5 a pound to $2 a pound. The relative price of 1 pound of pasta has now increased from 2 pounds of rice to 5 pounds of rice. Therefore, John switches away from pasta and to rice. The change in consumption occurs purely due to the changes in the relative price of the goods and not because of a change in income.
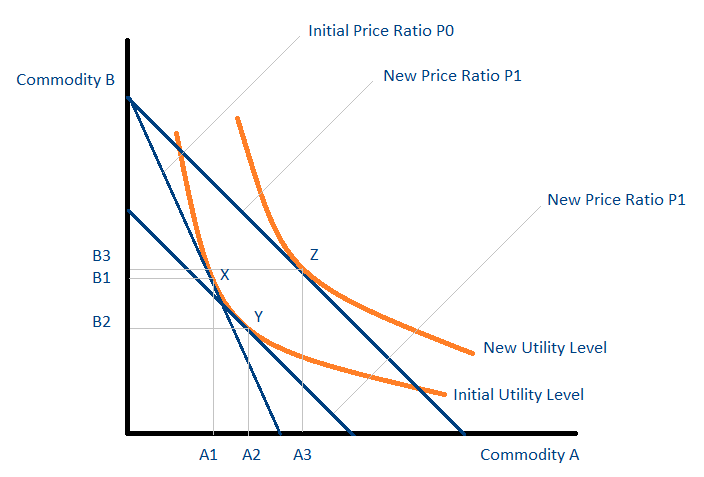
The graph above is known as an indifference map. Each point on an orange curve (known as an indifference curve) gives consumers the same level of utility. The initial price ratio is P0. This is the price of commodity B relative to commodity A and is known as the relative price of commodity B in terms of commodity A. The consumer initially consumes at point X and consumes A1 units of A and B1 units of B.
Consider now the effect of a fall in the price of commodity A from P0 to P1. As a result of the price change, commodity B is now relatively more expensive in terms of commodity A, and commodity A is now relatively less expensive in terms of commodity B. The substitution effect measures the change in consumption such that the consumer’s level of utility does not change.
The substitution effect can, therefore, be thought of as a movement along the same indifference curve. It results in a change in consumption from point X to point Y. The consumption of commodity A increases from A1 to A2, and the consumption of commodity B decreases from B1 to B2. Points X and Y give the consumer the same level of utility as they lie on the same indifference curve.
It is important to note that Y is not the final point of consumption. At point Y, the consumer has unused income that can be used to increase consumption. The increase in consumption from point Y to point Z is due to the income effect.
A core result in microeconomics is the Slutsky Decomposition, also known as the Slutsky Equation. Russian-Soviet economist and mathematician Eugene Slutsky developed the equation. The Slutsky Decomposition breaks down the change in the demand (or consumption) of a commodity into a change in the demand due to the substitution effect and a change in the demand due to the income effect.
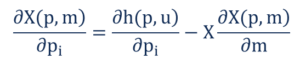
The left-hand side of the equation represents the change in demand for commodity X as a result of a change in the price of commodity i. The first term on the right-hand side represents the substitution effect. Mathematically, it is the slope of the compensated demand (Hicksian demand) curve. The second term on the right-hand side represents the income effect.
Connect what you just learned to a clear career path with CFI’s role‑based courses and certification programs.
Thank you for reading CFI’s guide to the Substitution Effect. To keep learning and developing your knowledge of financial analysis, we highly recommend the additional CFI resources listed below:


