Get Certified for
Capital Markets (CMSA®)
From equities and fixed income to derivatives, the CMSA certification bridges the gap from where you are now to where you want to be — a world-class capital markets analyst.
A chart that shows the stock price support and resistance levels, as well as trend direction and momentum
The Ichimoku Cloud is a technical analysis method that was created by Japanese journalist Goichi Hosoda in the late 1960s. The Ichimoku chart shows support and resistance levels, as well as other essential information such as trend direction and momentum. Compared to standard candlestick charts, the Ichimoku Cloud contains more data points, increasing the accuracy of forecast price moves.
The Ichimoku Indicator includes many lines and information that may be complicated for inexperienced traders to understand. However, traders who know how to read and interpret the Cloud use it as a key tool for trading.
Several elements make up the Ichimoku Cloud. The elements consist of the following five moving averages:
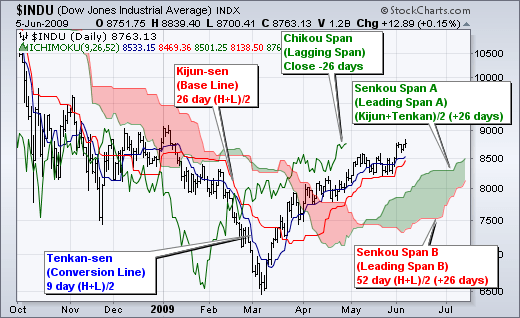
The first component of the Ichimoku Cloud is the Tenkan-Sen, often represented by a red line on the chart. It is a moving average that is calculated by taking the average of the high and the low for the last nine periods. The market is deemed to be trending if the Tenkan-Sen is moving up or down. However, if the line moves horizontally, it indicates a ranging market. It is calculated as follows:
Tenkan-Sen = (9-Period Highest High + 9-Period Lowest Low) / 2
The Kijun-Sen is a support/resistance line that acts as an indicator of price movements in the future. It is usually represented by a blue line. The Kijun-Sen is similar to the Tenkan-Sen, but takes a longer time frame into consideration, usually 26 periods compared to Tenkan-Sen’s nine periods.
It is measured by taking the average of the highs and lows for the last 26 periods. When plotted on a chart, the Kijun-sen typically lags behind the Tenkan-sen since the former comprises longer periods than the latter.
Kijun-Sen= (26-Period High + 26-Period Low) / 2
Senkou Span is the average of the highs and lows of Tenkan-Sen and Kijun-Sen and is plotted 26 periods to the right. On a chart, the Senkou span A is represented by an orange line. If the security price is above the Senkou span A (orange line), the top and the bottom lines become the first and second support levels, respectively.
Conversely, when the price moves below the Senkou span A, the bottom and the top lines become first and second resistance levels, respectively.
Senkou Span A = (Tenkan-Sen + Kijun Sen) / 2
It is calculated by taking the average of the high and low of the past 52 periods and plotting it 26 points to the right.
Senkou Span B = (52-Period High+ 52-Period Low) / 2
The Chikou Span, also known as the lagging span, is represented by a green line. It is formed by taking the current price and shifting it back 26 periods to the left. If the Chikou span crosses the price from the bottom-up, it demonstrates a buy signal. However, if the line crosses the price from the top-down, it is a sell signal.
The cloud provides the trend direction, and it also indicates support and resistance levels. It is formed by the two Senkou Span lines, A and B. The trend is dependent on the location of price vis-a-vis the cloud. For example, when the price is above the cloud, the trend is up, while the trend is down when the price is below the cloud. If the price is in the Ichimoku Cloud, the trend is flat or undetermined.
The strength of the trend can also be influenced by the position of Senkou span A and B. For example, when A moves above B, the trend is stronger in the bottom-up direction, while the opposite is true when Senkou span B moves above Senkou Span A.
When the Tenkan-Sen line moves above the Kijun-Sen line, this is a buy signal. Ideally, the two lines and the security price should be above the Ichimoku Cloud. On the other hand, when the Tenkan line (red line) intersects and goes below the Kijun-Sen line, it yields a sell signal.
The two components and the price should also be located below the cloud. Traders may use other indicators, such as the Relative Strength Index, to complement the Ichimoku Cloud and maximize risk-adjusted returns.
One of the downsides of the Ichimoku Cloud is that it is based on historical data. Historical tendencies may not repeat in the future as traders may expect.
Like any technical indicator, the Ichimoku Cloud may produce false signals. Also, depending on the time frame the indicator is applied to, it may not account for larger trends.
Connect what you just learned to a clear career path with CFI’s role‑based courses and certification programs.
Thank you for reading CFI’s explanation of the Ichimoku Cloud. CFI is the official provider of the global Financial Modeling & Valuation Analyst (FMVA)™ certification program, designed to help anyone become a world-class financial analyst. To keep advancing your career, the additional resources below will be useful:


