Football Field Chart
Why is it Called a Football Field?
The bars look like yard lines on a football field, and hence the name. Also, the graph is commonly used in investment banking, and bankers like sports analogies.
Why Use a Football Field Chart?
It is used to visually show what the range of values is for a business and to see where, on average, a target valuation lies compared to several alternatives. It’s common to see these charts in an investment banking pitch book or equity research report.
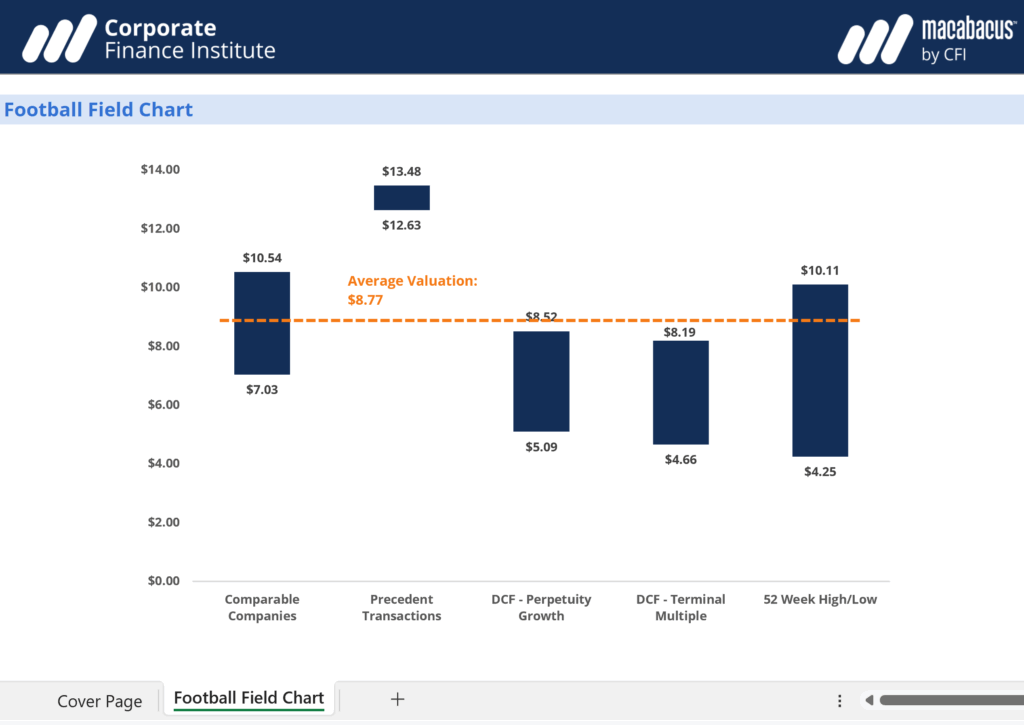
Football Field Chart Template
This football field chart template can be used to summarize a range of values for a business based on different valuation methods.
Below is a screenshot of the football field chart template:
Download CFI’s Free Football Field Chart Template
Enter your name and email in the form below and download our free Football Field Chart template now!
The purpose of the football field chart is to show how much someone might be willing to pay for a business, whether acquiring all of it, part of it, or just a single share (depending on the audience).
More Free Templates
For more resources, check out our business templates library to download numerous free Excel modeling, PowerPoint presentations, and Word document templates.
Excel Tutorial
To master the art of Excel, check out CFI’s Excel Crash Course, which teaches you how to become an Excel power user. Learn the most important formulas, functions, and shortcuts to become confident in your financial analysis.

Launch CFI’s Excel Crash Course now to take your career to the next level and move up the ladder!


