Get Certified for Financial Modeling (FMVA)®
Gain in-demand industry knowledge and hands-on practice that will help you stand out from the competition and become a world-class financial analyst.
Cash flow that a company has generated on a per share basis
Cash earnings per share (cash EPS) is the operating cash flow generated by a company divided by the number of shares outstanding. Cash earnings per share (Cash EPS) is different from traditional earnings per share (EPS), which takes the company’s net income and divides it by the number of shares outstanding. In other words, EPS measures how much of the company’s profit can be allocated to each share of stock, while Cash EPS measures how much cash flow can be allocated to each share of stock.
A company with higher cash earnings per share is considered to show better financial performance and have a better ability to generate cash flow. Cash EPS can be used to compare the company against its peers or against its own past results.
We calculate Cash EPS by adding non-cash transactions – e.g., amortization, depreciation, and deferred tax – back into Net Income to find operating cash flow. This is then divided by the number of shares.
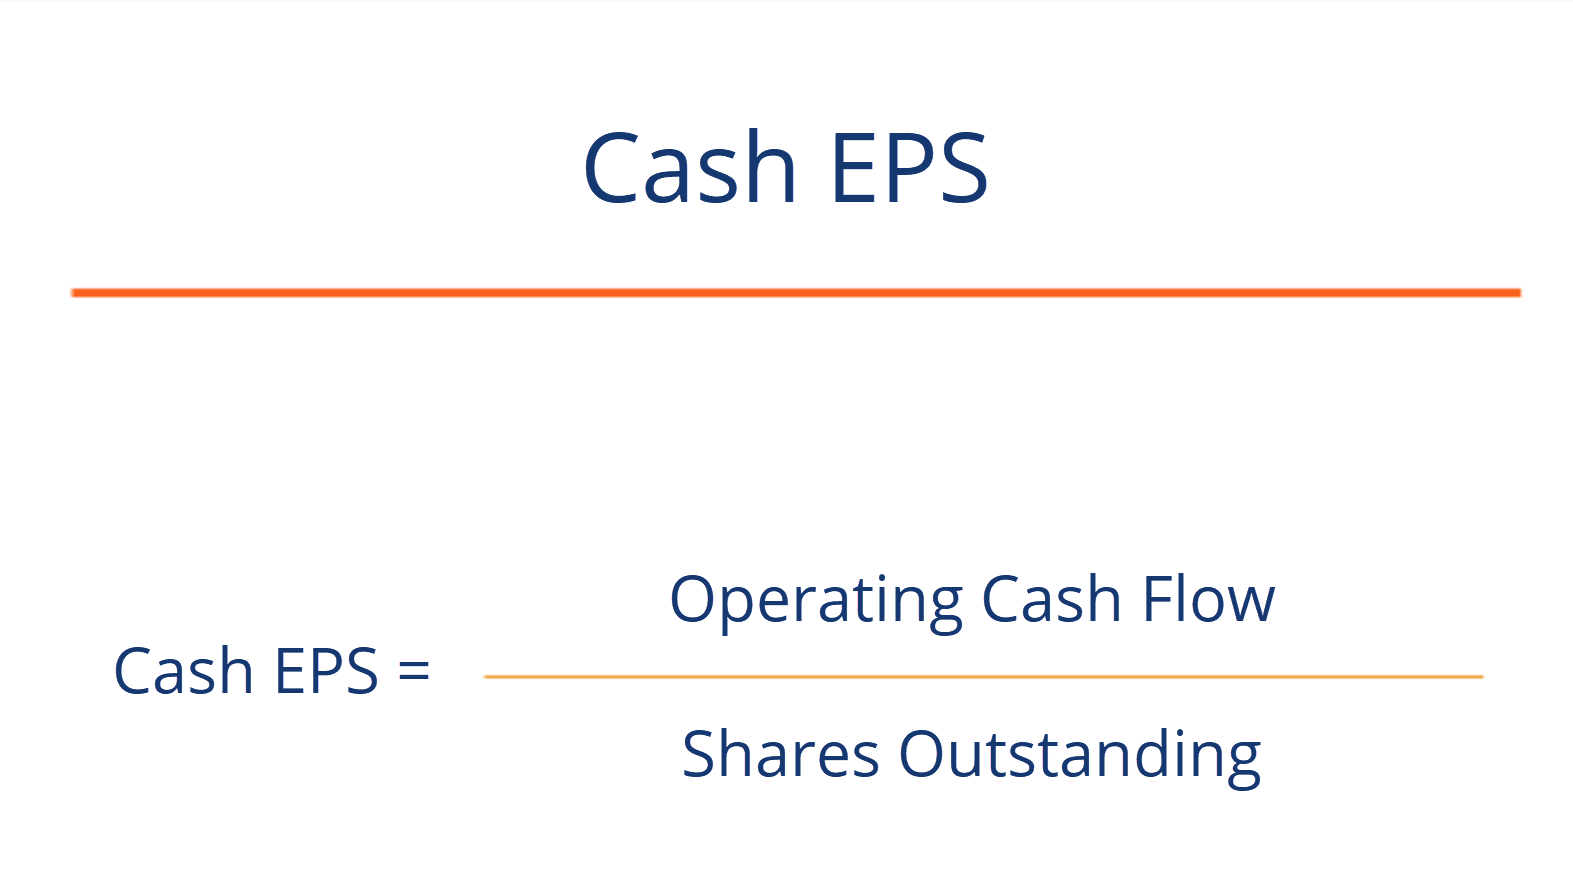
Cash EPS = Operating Cash Flow / Diluted Shares Outstanding
A non-cash transaction is one that is captured in the company’s income statement but that does not involve actual cash flow during the period recorded. For example, depreciation expense is deducted from net income but does not actually involve any outflow of cash. Thus, this must be added back to net income to remove the accounting impact.
Note: Cash EPS is different from Diluted EPS. Diluted EPS refers to net income divided by the number of fully diluted shares outstanding (a metric used to measure the earnings per share of a company if all its convertible securities are exercised). Convertible securities refer to a company’s outstanding warrants, stock options, convertible debentures, and convertible preferred shares. The company’s diluted EPS will always be lower than the Cash EPS.
Click the button below to download CFI’s free Cash EPS calculator!
Cash earnings per share shows the ability of the company to generate cash flow that can be used for many things, including servicing its debts, paying shareholders’ dividends, and undertaking other transactions. A company with higher cash earnings per share is considered to be worth more per share than a company with a lower cash EPS (all else being equal).
As a general rule with investors, high earnings per share growth leads to a rise in the company’s share price.
In order to compare the value of two different companies, the price-earnings ratio can be a helpful starting point.
Connect what you just learned to a clear career path with CFI’s role‑based courses and certification programs.
We hope you have enjoyed reading CFI’s guide to Cash EPS – to learn more about profitability ratios, we recommend the following CFI resources:


