Get Certified for
Capital Markets (CMSA®)
From equities and fixed income to derivatives, the CMSA certification bridges the gap from where you are now to where you want to be — a world-class capital markets analyst.
The number of goods or services produced and sold by businesses at a particular market price
Quantity supplied is the volume of goods or services produced and sold by businesses at a particular market price. A fluctuation in the price level leads to a change in the quantity supplied. The fluctuation is called the price elasticity of supply. Therefore, the quantity supplied depends on the price level, and the price of a product can sometimes be fixed by a regulatory body using price ceilings or floors.

A price ceiling forces the suppliers to sell their goods or services no higher than a particular price. An example of a price ceiling is rent controls in New York. When a price ceiling is implemented, suppliers will sell less of their products, as there is no intention to sell more due to the price cap.
A price floor is when the supply cannot charge or pay below a certain price. An example of a price floor is minimum wage.
The goal of suppliers is to increase their profits. Generally, suppliers determine the number of products produced in the market at various price points, but they have no control over the quantity demanded.
Consumers will be able to buy products at the optimal price when market forces are allowed to operate freely without any government intervention. The relationship between consumers and suppliers is inverse, as suppliers want to sell their products at a high price, and consumers want to buy them at the lowest possible price.
Therefore, the ideal quantity supplied is where consumers and suppliers meet in the middle and where the demand curve intersects the supply curve. The point is called the equilibrium price point. Suppliers are willing to produce and supply their products at such a price point, and consumers are willing to pay for those products.
At a price equilibrium, it is advised that suppliers not change their quantity supplied to maintain optimal profits. This is because, at price equilibrium, quantity demanded remains constant, as an increase in supply will increase the suppliers’ unsold goods, and a decrease in supply will reduce revenue.
According to economic theories, markets should focus on achieving an equilibrium, but many forces prevent a market from achieving equilibrium. Many markets do not operate freely, as external forces – such as government regulations – influence supply.
Another important factor to consider is the elasticity of supply and demand. An elastic supply or demand responds to fluctuations in price, and when they are inelastic, they do not. It is the reason inelastic goods and services are not always in equilibrium.
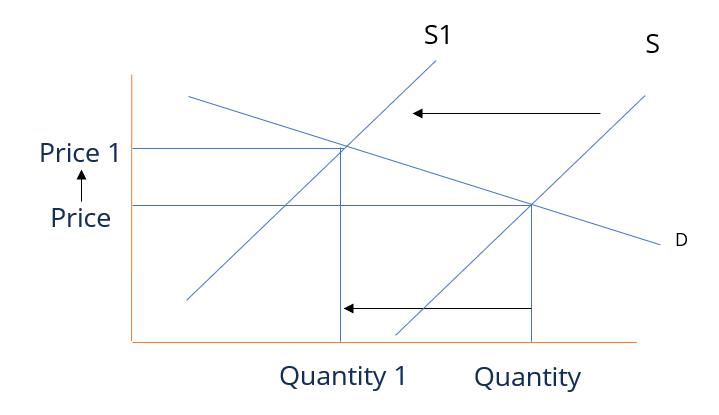
The demand and the supply curves are plotted on the same graph. The y-axis is the quantity, and the x-axis is the price. The supply curve is upward-sloping, and the demand curve is downward-sloping, representing the inverse relationship between supply and demand.
The supply curve is upward sloping because the producers of products are willing to supply more goods at a higher price. The downward-sloping demand curve is because consumers demand less quantity at higher prices and will buy less at a higher price for a particular product.
The following factors affect the supply curve:
When there are technological improvements in production, the supply curve shifts to the right. On the other hand, if the technology does not evolve and increase production, the supply curve will shift to the left.
There is an inverse relationship between production costs and input price concerning the supply curve. Hence, an increase in input price and production cost will lead to an opposite change in the supply curve and vice-versa. For example, a decrease in manufacturing overhead costs will shift the supply curve to the right, as it is cheaper to produce a good or service.
In order to affect the supply curve, the goods or services must be related, and customers must think the relationship is relevant. Product substitutes are different from joint products.
An example of a product substitute is corn and soybeans as they utilize the same resource for poduction (farmland). If the price of corn decreases, farmers will grow more soybeans, and more land is available to grow soybeans. It increases the supply of soybeans.
CFI is the official provider of the Capital Markets & Securities Analyst (CMSA®) certification program, designed to transform anyone into a world-class credit analyst.
In order to help you become a world-class financial analyst and advance your career to your fullest potential, the additional resources below will be very helpful:


