Get Certified for
Capital Markets (CMSA®)
From equities and fixed income to derivatives, the CMSA certification bridges the gap from where you are now to where you want to be — a world-class capital markets analyst.
A graphical representation of how many units of a good or service will be purchased at each possible price
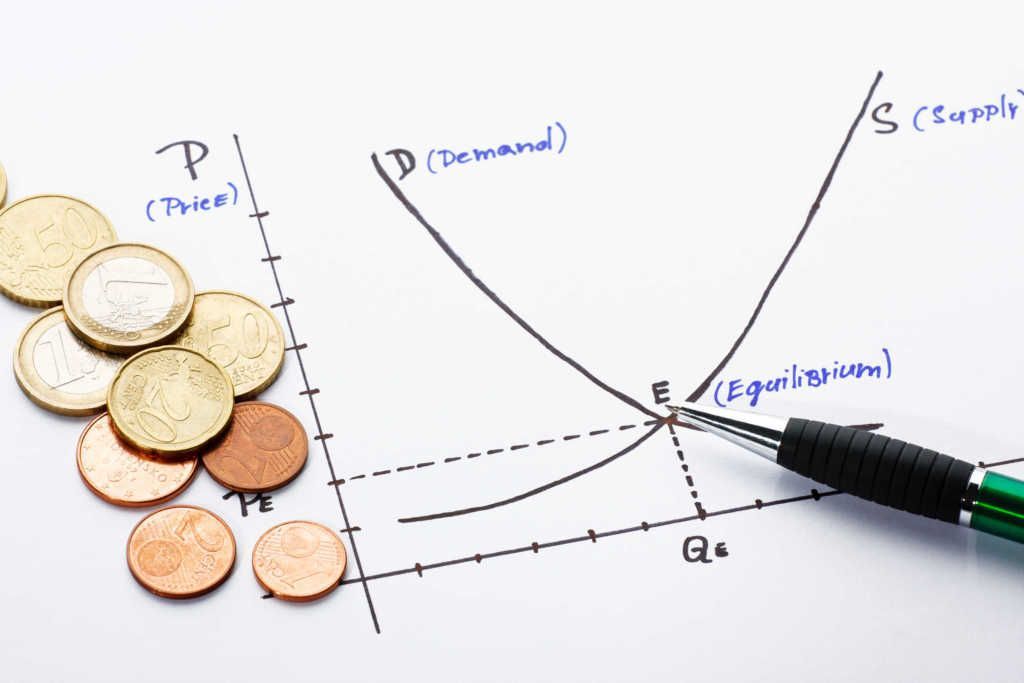
The demand curve is a line graph utilized in economics, that shows how many units of a good or service will be purchased at various prices. The price is plotted on the vertical (Y) axis while the quantity is plotted on the horizontal (X) axis.
Demand curves are used to determine the relationship between price and quantity, and follow the law of demand, which states that the quantity demanded will decrease as the price increases. In addition, demand curves are commonly combined with supply curves to determine the equilibrium price and equilibrium quantity of the market.
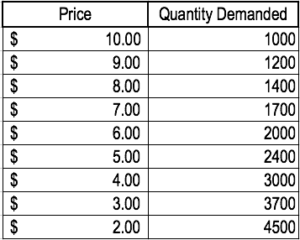
The demand curve is based on the demand schedule. The demand schedule shows exactly how many units of a good or service will be purchased at various price points.
For example, below is the demand schedule for high-quality organic bread:

It is important to note that as the price decreases, the quantity demanded increases. The relationship follows the law of demand. Intuitively, if the price for a good or service is lower, there is a higher demand for it.
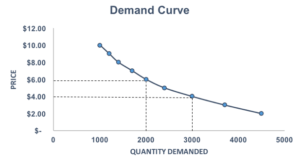
From the demand schedule above, the graph can be created:
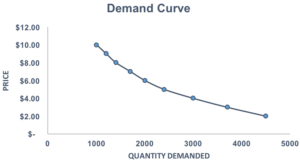
Through the demand curve, the relationship between price and quantity demanded is clearly illustrated. As the price for notebooks decreases, the demand for notebooks increases.
Shifts in the demand curve are strictly affected by consumer interest. Several factors can lead to a shift in the curve, for example:
If the good is a normal good, higher income levels lead to an outward shift of the demand curve while lower income levels lead to an inward shift. When income is increased, the demand for normal goods or services will increase.
A growing market results in an outward shift of the demand curve while a shrinking market results in an inward shift. A larger market size results from more consumers. Therefore, the demand (due to more consumers) will increase.
When the price of complementary goods decreases, the demand curve will shift outwards. Alternatively, if the price of complementary goods increases, the curve will shift inwards. The opposite is true for substitute goods. For example, if the price of peanut butter falls significantly, demand for its complementary good, jelly, increases.
Recall the demand schedule for high-quality organic bread:

Assume that the price of a complementary good – peanut butter – decreases. How would this affect the demand curve for high-quality organic bread?
Since peanut butter is a complementary good to high-quality organic bread, a decrease in the price of peanut butter would increase the quantity demanded of high-quality organic bread. When consumers buy peanut butter, they also buy organic bread (hence, complementary). If the price of peanut butter decreases, more consumers purchase it. Therefore, consumers would also purchase more high-quality organic bread as it is a complement to peanut butter.
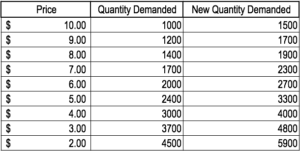
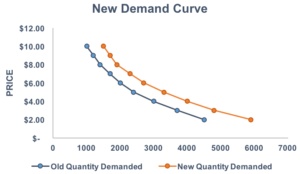
We can see from the chart above that a decrease in the price of a complementary good would increase the quantity demanded of high-quality organic bread.
Changes in price cause movements along the demand curve. Following the original demand schedule for high-quality organic bread, assume the price is set at P = $6. At this price, the quantity demanded would be 2000.
If the price were to change from P = $6 to P = $4, it would cause a movement along the demand curve, as the new quantity demanded would be 3000.
Connect what you just learned to a clear career path with CFI’s role‑based courses and certification programs.
CFI is a leading provider of financial certifications and analyst training. To continue learning and advancing your career, these additional CFI resources will be helpful:


