Get Certified for Financial Modeling (FMVA)®
Gain in-demand industry knowledge and hands-on practice that will help you stand out from the competition and become a world-class financial analyst.
A sharp rise or fall of data points after a long flat period
The hockey stick effect is characterized by a sharp rise or fall of data points after a long flat period. It is illustrated using the graphical shape of a line chart that resembles a hockey stick. The hockey stick chart formation illustrates that urgent action may be required to understand a phenomenon or find a solution for the drastic shift in data points.
In business, a hockey stick chart is used to show significant growth in revenues, EBITDA, and EBITDA margins. It is also used to show dramatic shifts in sales, poverty statistics, global temperatures, etc.
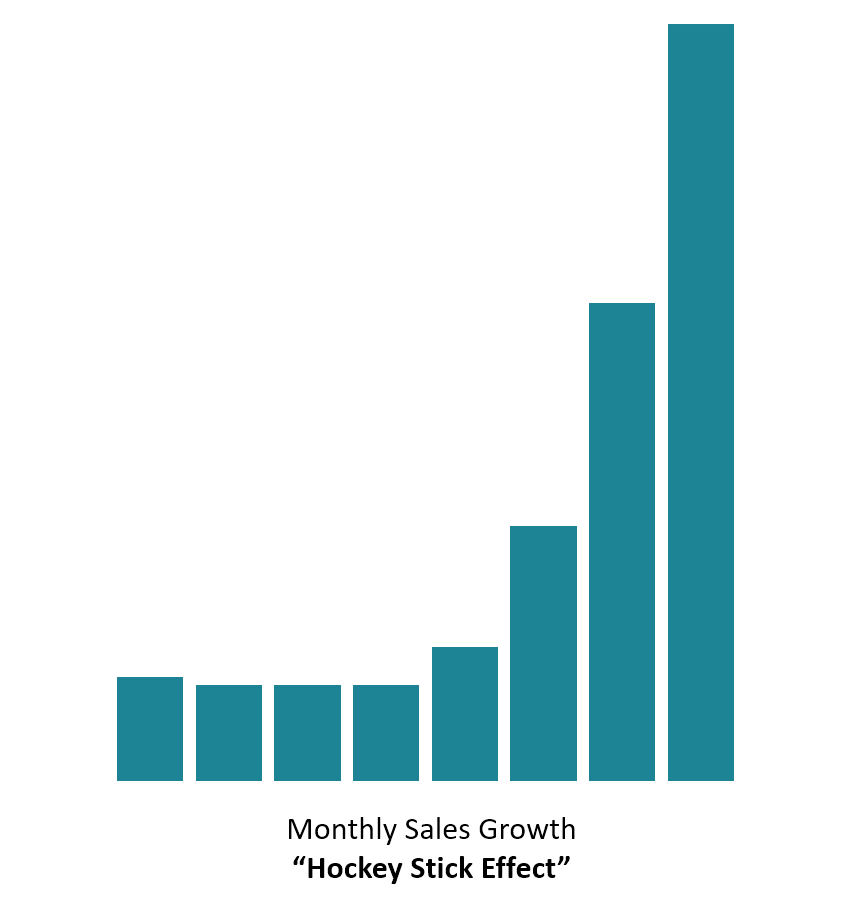
A hockey stick comprises a blade, a sharp curve, and a long shaft. The curve starts at a low-activity level on the X-axis for a short period of time. Then, there is a sudden bend followed by a long rise with a steep curve.
When such a dramatic shift occurs from a flat period with no activity to a “hockey stick” curve, it is a clear indication that action is needed to understand the causative factors. In a business, the chart may be representative of, for example, large problems within the sales process. Some of the possible problems are misaligned goals, weak value proposition, or hands-off management style. Understanding the chart may lead to a realignment of goals, processes, or business strategies.
When a hockey stick effect occurs, the majority of revenues of a company are concentrated in the last part of a period (either week, month, quarter or year). The unbalanced sales performance results in the following effects on a company:
When a large number of customer orders are made at the end of a sales period, it can put a strain on the customer service and delivery teams. When the company’s been performing below its usual limits, and then sales start accelerating at the end of the period, the company’s resources may be stretched to the limits.
Resulting difficulties can lead to unfulfilled orders, exhausted staff members, worker stress, and delivery mismatch. It can leave some customers unhappy because their orders were either not delivered or not properly filled. If the problem is not addressed immediately, it could result in significant, long-term customer losses.
An influx of orders and a stretched sales team can easily lead to unhappy customers. Customers who received the wrong products or low-quality products will return the products and ask for a refund or replacement.
Either way, this leads to a loss of revenues and negative impacts on the company’s image. It’s more difficult to repair a damaged customer relationship than to establish a good relationship to start.
After a period characterized by a low number of sales and unhappy customers, the company may offer special discounts as a way of attracting new customers and retaining existing ones. The company may offer, for example, discounts or a free item for every two items purchased.
Discounts and special terms can result in a sharp increase in sales as customers take advantage of generous promotions. This may put a strain on the sales teams as they work to ensure all the promises are fulfilled and prevent any incidences of losses from occurring. If sales still slump, the discounts and special terms will lead to a direct loss of profits.
There are several steps that the management of a company can take to solve the hockey stick effect, including:
The company can optimize the sales process to make sales forecasts more accurate. This can be achieved by getting the sales teams to generate forecasts that are based on more reliable metrics like current leads, the value of active sales cycles, close ratios, and the average sales cycle time. The forecasts should then be sent to the appropriate levels of management to combine the figures into a detailed report. Getting sales forecasts from the sales reps to upper management is more reliable than having management prepare the estimates and send them to the sales teams.
Using CRM software can help a company monitor, review and enhance sales performance in real-time. It enables management or sales representatives to identify any bottlenecks that may affect the sales process and seek immediate remedies. They can also monitor the sales process to identify stages that are taking too long to complete, pinpoint the causes, and find quick solutions. CRM software also helps to monitor customer conversion rates at various stages of the sales cycle. It can also help in testing business strategies that can then be replicated.
The sales teams should rely on tried and proven sales analytics to track incoming sales from the beginning to the end of the sales period. If there are lapses or sudden changes in the process, the sales team can identify the causes and take corrective measures. As the end of the sales period nears, the company should not resort to unusual discounts and special terms that reduce the amount of profits.
Thank you for reading CFI’s guide to the Hockey Stick Effect. To help you advance your career in the financial services industry, check out the additional CFI resources below:
Below is a break down of subject weightings in the FMVA® financial analyst program. As you can see there is a heavy focus on financial modeling, finance, Excel, business valuation, budgeting/forecasting, PowerPoint presentations, accounting and business strategy.

A well rounded financial analyst possesses all of the above skills!
CFI is the global institution behind the financial modeling and valuation analyst FMVA® Designation. CFI is on a mission to enable anyone to be a great financial analyst and have a great career path. In order to help you advance your career, CFI has compiled many resources to assist you along the path.
In order to become a great financial analyst, here are some more questions and answers for you to discover:


