Get Certified for
Capital Markets (CMSA®)
From equities and fixed income to derivatives, the CMSA certification bridges the gap from where you are now to where you want to be — a world-class capital markets analyst.
A high-risk, high-reward approach to investing
An aggressive investment strategy is a high-risk, high-reward approach to investing. Such a kind of strategy is appropriate for younger investors or those with higher risk tolerance. The focus of aggressive investing is capital appreciation instead of capital preservation or generating regular cash flows.

A standard example of an aggressive strategy compared to a conservative strategy would be the 80/20 portfolio compared to a 60/40 portfolio. An 80/20 portfolio allocates 80% of the wealth to equities and 20% to bonds, compared to a 60/40 portfolio, which allocates 60% and 40%, respectively.
The following sections discuss five methods that can be used to implement an aggressive strategy and present a quantitative analysis of the performance of aggressive and conservative strategies through time.
There are many ways to pursue an aggressive investment strategy. Below are five strategies that most investors can utilize based on their income and sophistication.
Small-cap stocks provide the potential of very high capital appreciation. The prices can compound to more than two times the original price if the business becomes successful and achieves strong revenue growth and profitability.
The risk with small-cap stocks is that one can lose their entire investment if the business fails. Sometimes a business can be outright fraudulent, which is common in small-cap stocks because there is not enough due diligence on smaller companies. Hence, it is important to rigorously research the companies before investing.
Emerging markets are growing economies primarily located in Asia and parts of Eastern Europe. The countries has a high potential for economic growth, growing rapidly over the past few decades. Investments in emerging markets can rapidly compound as the economy grows and is one of the most robust ways to grow an investment.
On the other hand, emerging markets usually lack the high-quality institutions and governance found in developed markets. Thus, regulatory and political risks are more salient in emerging markets. Moreover, there might be friction to investing in emerging markets like regulatory hurdles or currency issues.
High-yield bonds are a popular source of yield for investors looking for higher returns while generating regular cash flows. The bonds are typically high coupon bonds with below-investment-grade credit ratings – also known as speculative grade or junk bonds.
The risks with high yield bonds are like small-cap stocks. Hence, the issuing companies should be well-researched to ensure there are no liquidity and solvency issues.
Options can be used to hedge against or speculate on movement in security prices. They are non-linear securities and can provide a constant source of income in times of low volatility or generate massive payoffs during large market moves.
A common strategy is to sell options to collect a premium. If the market is not very volatile, such a strategy can provide a high return, but an investor can lose more than what they’ve made over time on a single market move that goes against the investor’s position.
Private investments are more suitable for investors with higher net worth. There are many avenues in private markets, such as angel investing, where a single investment can range from $10,000 to $50,000 in a single business.
If successful, the business can compound rapidly, returning a high multiple of the initial investment. There are opportunities like venture capital, private equity, and debt that require much higher capital commitment.
Quantitative analysis involves collecting and assessing measurable and verifiable data to understand the behavior and performance of companies. It helps decision-makers make informed decisions, particularly with the assistance of data technology methods.
The data used for this quantitative analysis example is from the Fama-French database on factor returns. The dataset of monthly returns starting in 1926 divides the universe of companies into deciles based on size or market capitalization. For the purpose of the analysis, the lowest decile – i.e., the smallest companies – represents an aggressive investment strategy, while the top decile represents a conservative strategy.
The analysis presents the performance of both strategies across various metrics like the cumulative return, drawdown, and the Sharpe ratio. The analysis illustrates the risk-reward profile of the two strategies.
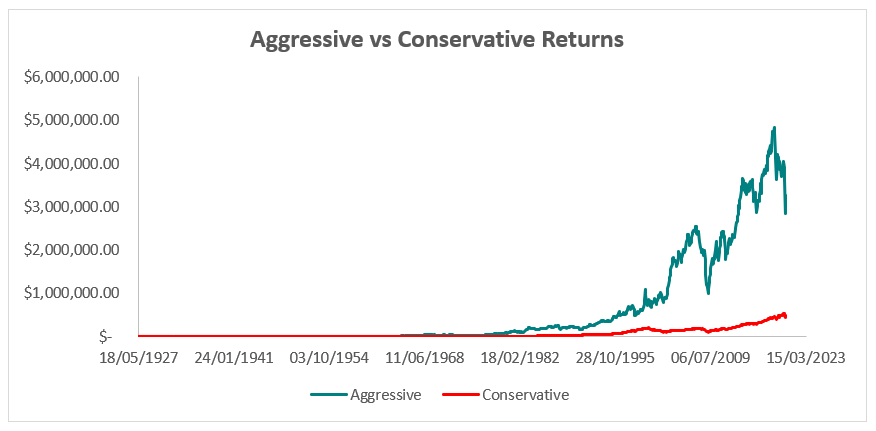
Cumulative Return: The cumulative return of a strategy is the value of a single dollar passively invested in the strategy over time. The chart below shows the return on both aggressive and conservative strategies over the data. It is clear from the chart below that an aggressive strategy vastly outperformed the conservative strategy.
The second chart plots the ratio of performance of aggressive and conservative strategies given by dividing the value of an aggressive portfolio by the value of a conservative portfolio.

Drawdown: The drawdown of a strategy measures the decline in the value of a portfolio from peak to trough. The chart below plots the drawdown of both strategies. Clearly, the aggressive strategy sess much higher drawdowns than the conservative strategy. Therefore, there is a higher risk of ruin or losing all the capital in an aggressive strategy.
To further explore the drawdowns, we plot the histogram of large drawdowns (greater than 50%). The histograms show that the frequency of deeper drawdowns is much higher for the aggressive strategy. According to the data, the median drawdown for the conservative strategy was about -5.08%, while for the aggressive strategy, it was -10.8%.

Portfolio Metrics: The portfolio metrics used to analyze the two strategies are the alpha and the Sharpe Ratio. The alpha measures the idiosyncratic over or underperformance of a strategy relative to a benchmark. The Sharpe ratio measures the risk-adjusted performance of a strategy as measured by the ratio of excess returns over the volatility of return.
Over a 30-year horizon starting in 1990, data shows the pattern that an aggressive strategy can massively over-perform or underperform the benchmark in certain periods. On the other hand, the conservative strategy shows an alpha that remains in a small range.
The Sharpe ratio of an aggressive strategy is consistently below that of a conservative strategy, given that an aggressive strategy is riskier with very volatile returns. The average Sharpe ratio over the analysis of the period is 0.85 for the aggressive strategy, whereas the conservative strategy showed an average Sharpe ratio of 1.25.
CFI offers the Capital Markets & Securities Analyst (CMSA)® certification program for those looking to take their careers to the next level. To keep learning and advancing your career, the following resources will be helpful:


