Get Certified for
Capital Markets (CMSA®)
From equities and fixed income to derivatives, the CMSA certification bridges the gap from where you are now to where you want to be — a world-class capital markets analyst.
A technical analysis indicator composed of three separate lines
Keltner Channel refers to a technical analysis indicator composed of three separate lines. It includes a central moving average line along with channel lines located above and below the central one.
The Keltner Channel is named after American grain trader Chester W. Keltner, who described it in his 1960 book entitled “How to Make Money in Commodities.”
Keltner initially described it as a ten-day moving average, and his initial version showed the center line showing the typical price, with it being the average of the high, low, and close (closing) price. The lines above and below the centerline were drawn at a distance away, with the said distance being the simple moving average of the past 10 days’ trading ranges.
Here, the overall strategy is to regard a closing price above the upper line as a strong bullish signal while a close below the lower line is bearish. The Keltner Channel was later further revised by Linda Bradford Raschke, who added in different averaging periods, an exponential moving average, and the average true range (ATR) for the bands.
These revisions were not made separate from Keltner’s original idea, and there is still some confusion behind the exact definition of the Keltner Channel. However, the revisions are commonly accepted and used.
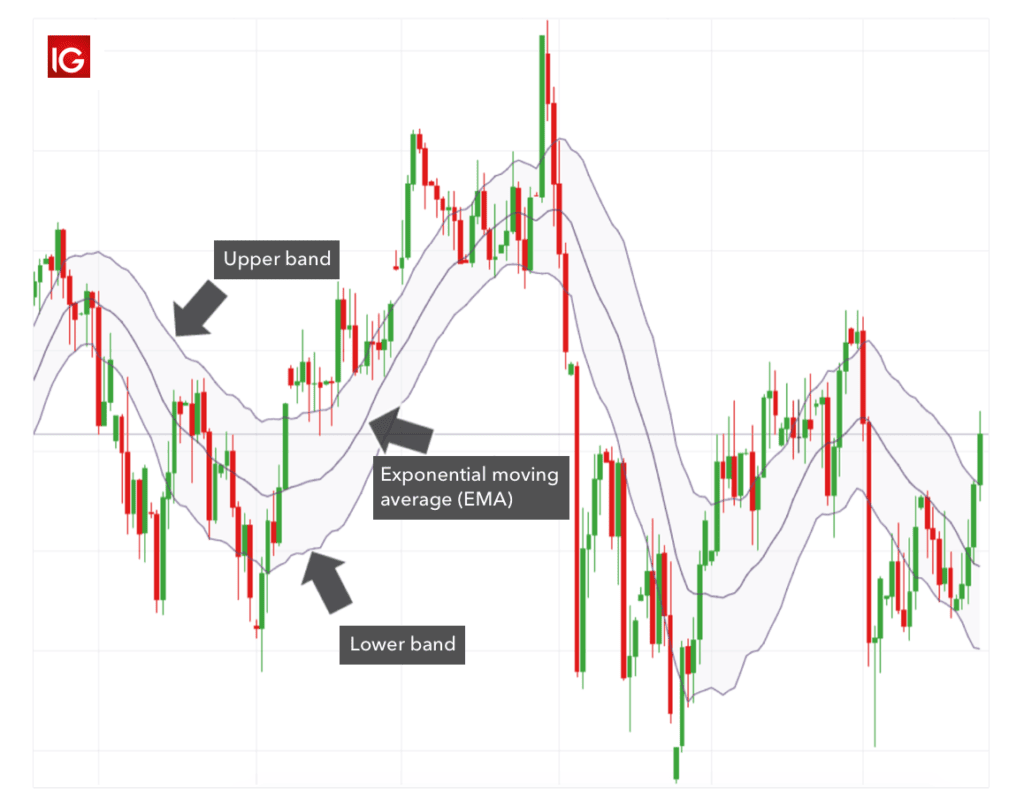
The Keltner Channel consists of three separate lines. The middle line is an exponential moving average (EMA) of the price and is similar to Keltner’s original centerline. Other lines are placed above (the upper band) and below (the lower band) the EMA and are usually set two times of the Average True Range (ATR).
The EMA is usually collected across 20 periods, contrasting to Keltner’s initial 10-day moving average. The formulas for these will be discussed in detail below, but the upper and lower bands expand and contract as the volatility does so.
It is common for most price action to take place between the upper and lower bands (known as the channel), so any extraneous activity will be scrutinized, as it likely represents trend changes or a larger phenomenon.
The channel’s direction or angle helps identify the direction of trends; when the channel is upwards, the price is rising, and when the channel is angled downwards, the price is falling.
The formulas below are important in knowing the components of the Keltner Channel:
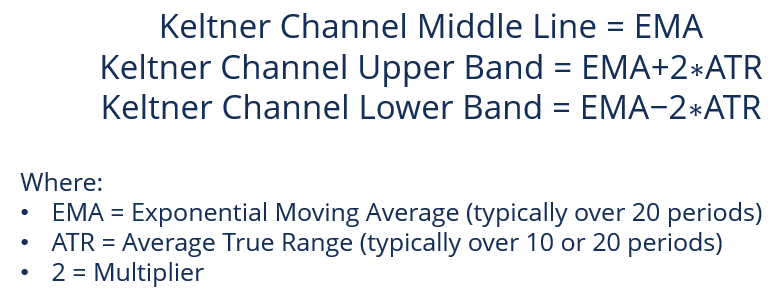
The Keltner Channel is used to analyze changes in price action, and it is designed so that any moves above or below the upper and lower bands (or channel lines) are relatively rare and require increased scrutiny.
Trends in the Keltner Channel often start with strong moves in either direction, with surges above the upper band, indicating unusual strength and the opposite indicating unusual weakness.
Strong moves such as these would typically signal the end of one trend and the beginning of another. However, there are also times where strong trends do not take hold after a channel breakout, and the prices only stay within the channel lines, indicated by rather flat moving averages.
As mentioned earlier, the time period chosen for the EMA is typically 20 periods but may be altered. A longer EMA indicates more lag, meaning that the channels do not respond as quickly to price changes.
Shorter EMAs means that the bands react quickly to price changes but may mean that the direction may be faulty if it changes frequently.
The multiplier for the ATR is also at the discretion of the user. Still, a larger multiplier means that the channels will be larger and the possibility of the prices hitting the upper or lower bands will be smaller. In contrast, smaller multipliers indicate that the bands are reached quite often.
CFI is the official provider of the global Capital Markets & Securities Analyst (CMSA)® certification program, designed to help anyone become a world-class financial analyst. To keep advancing your career, the additional CFI resources below will be useful:


