Get Certified for
Capital Markets (CMSA®)
From equities and fixed income to derivatives, the CMSA certification bridges the gap from where you are now to where you want to be — a world-class capital markets analyst.
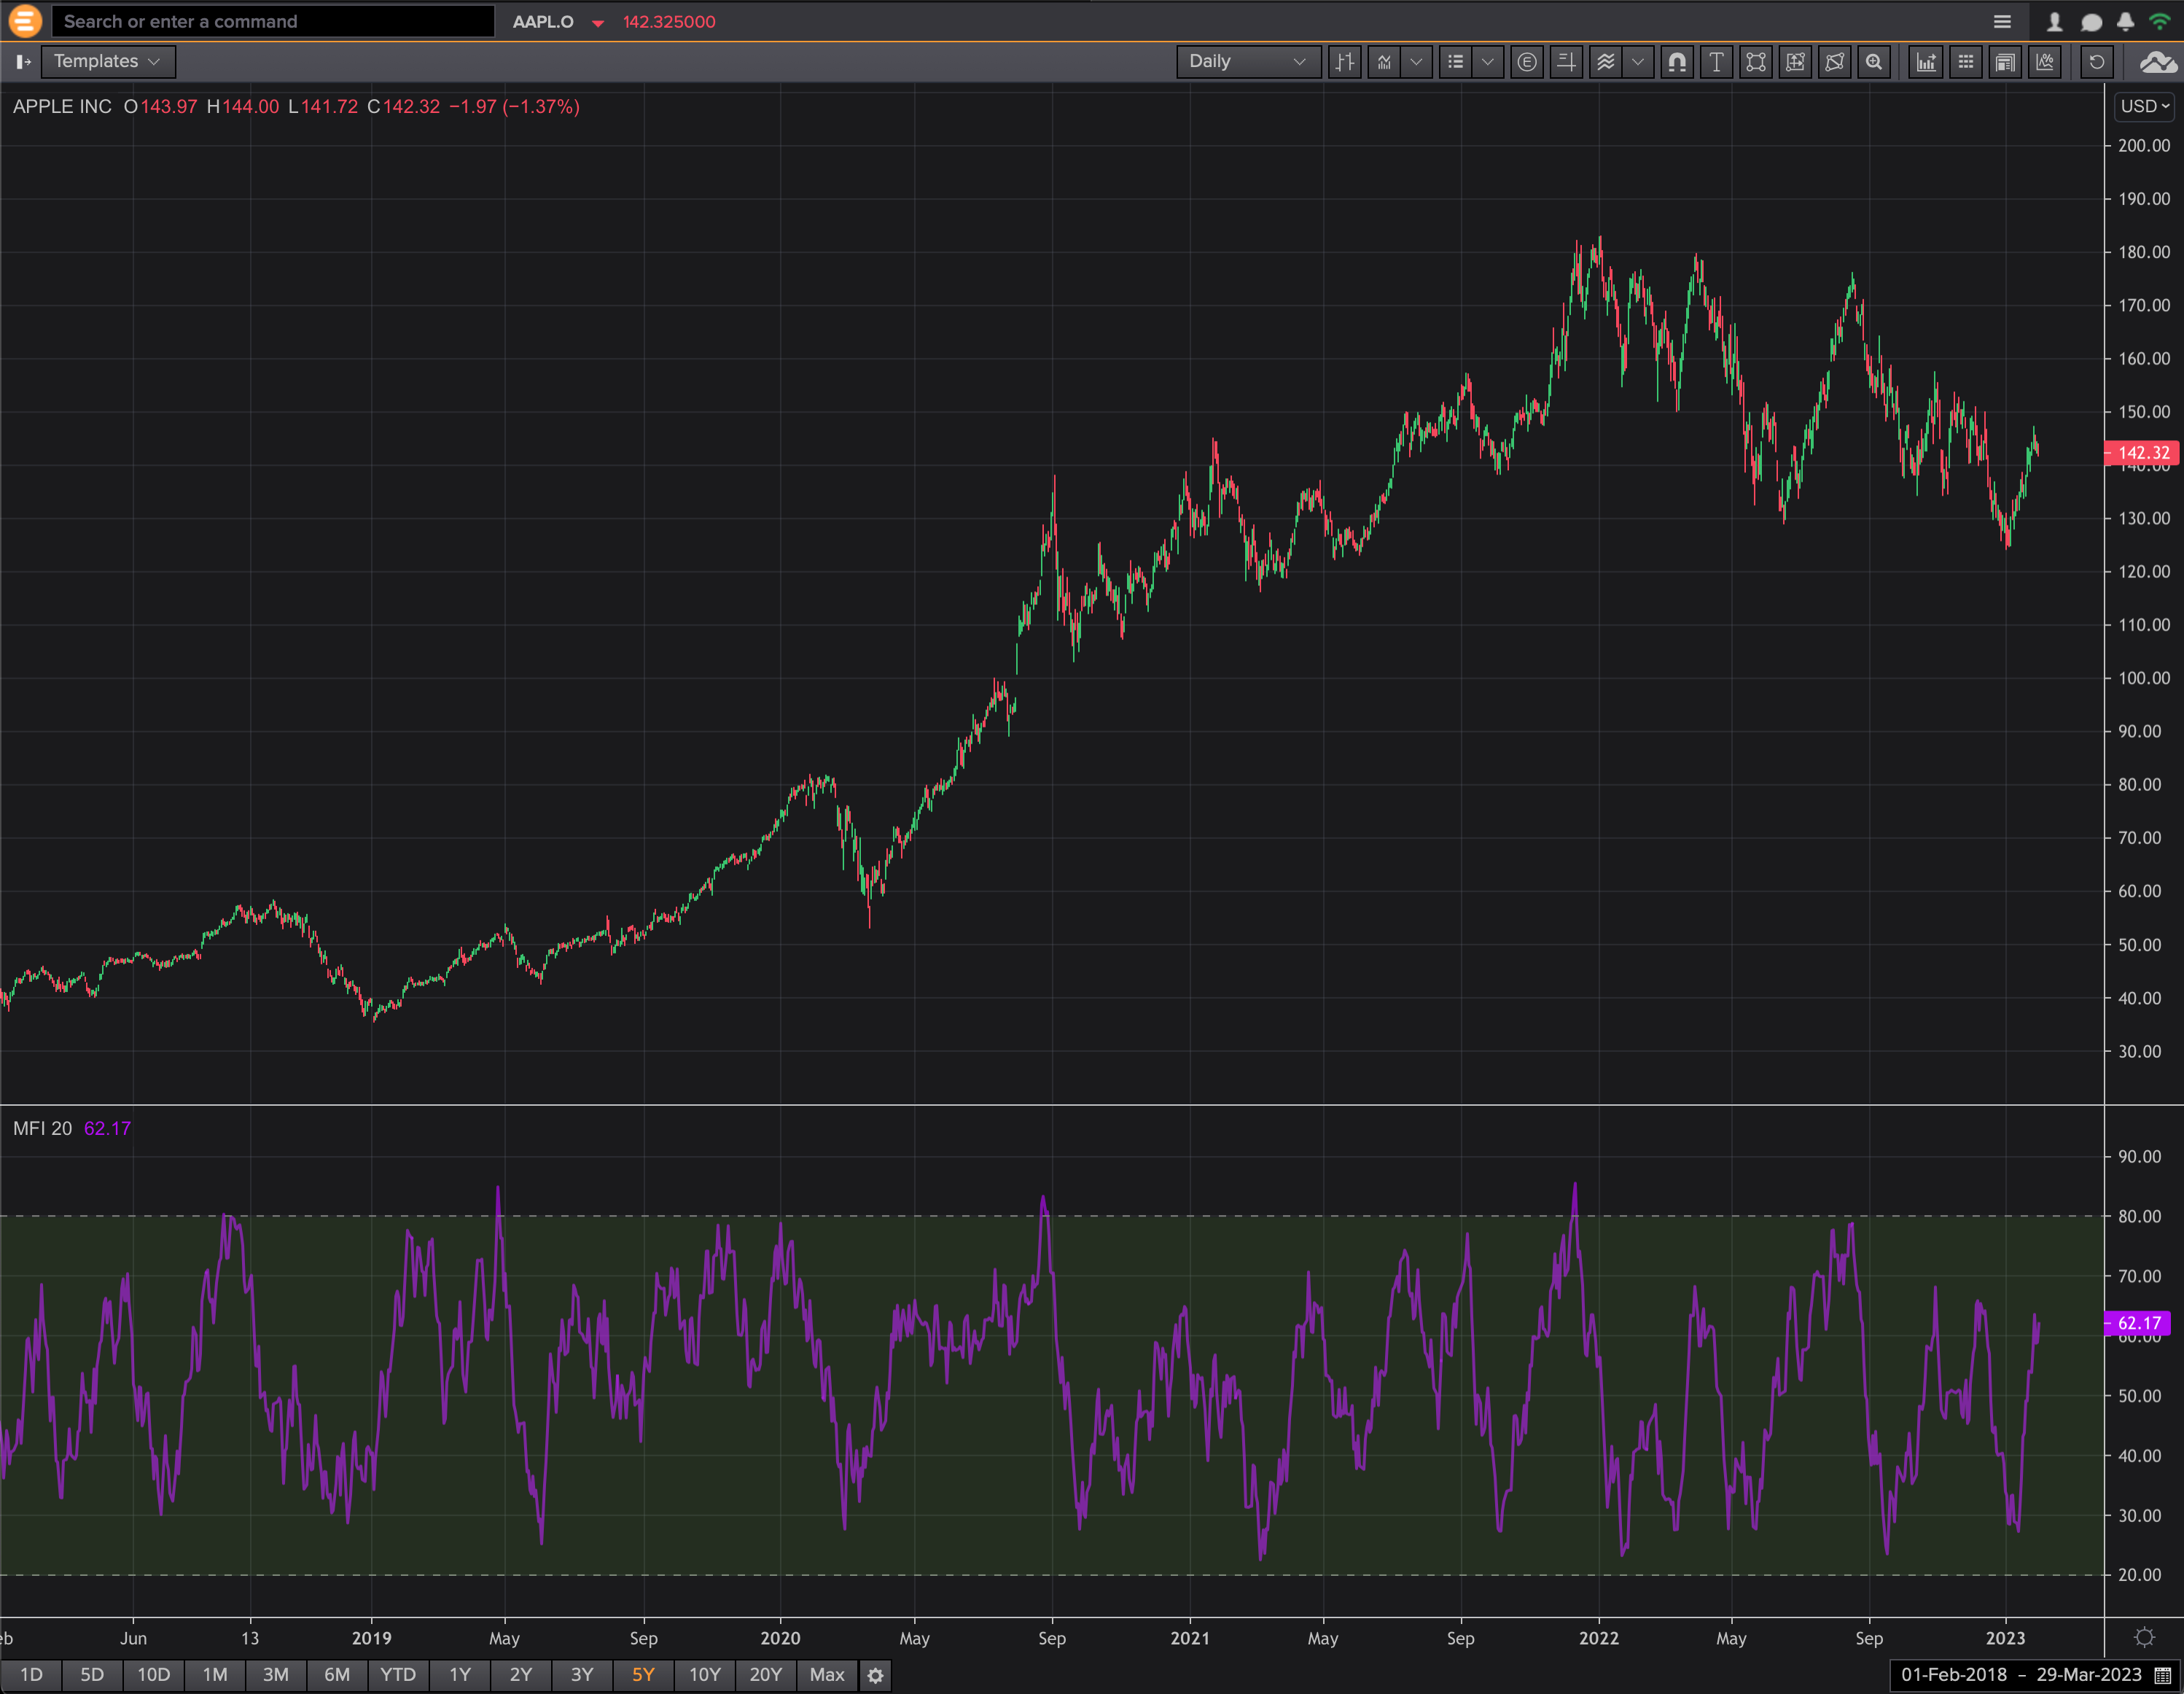
A technical analysis indicator that shows when a security is overbought or oversold
Money Flow Index (MFI) is a movement indicator used in technical analysis that looks at time and price to measure the trading pressure — buying or selling. It is also called volume-weighted Relative Strength Index (RSI), as it includes volume, unlike RSI, which only incorporates price.
Positive money flow is indicated by an increase in typical price, signaling buying pressure, whereas a decrease in typical price indicates a negative money flow, thus signaling selling pressure. These positive and negative money flows are accumulated to create a money flow ratio or money ratio.
The money ratio is used to find out the MFI that oscillates between 0 and 100. As the MFI incorporates volume, it can be used for the identification of price extremes and reversals with diverse signals.
Money Flow Index (MFI) can be calculated using the following steps:
If the typical price for today is higher than yesterday, it implies a positive money flow. If the typical price is lower, it implies a negative money flow. The aggregate of positive money over certain periods gives positive money flow, and the aggregate of negative money over certain periods gives negative money flow.
MFI generates three main signals: overbought/oversold conditions, failure swings, and divergences.
A security will be considered overbought if the MFI shows a fast price rise to a high level. Similarly, a security is considered oversold if the MFI indicates a rapid decline in the price to a considerably low level. The oversold and overbought levels are helpful in the identification of price extremes.
Generally, overbought conditions occur if the MFI is above 80, and below 20 MFI indicates oversold conditions. The prices may continue to rise while the upward trend is strong, and the MFI can increase beyond 80.
On the other hand, MFI can drop below 20 when the prices continue to fall in the presence of a strong downward trend. If the MFI increases above 90, it is considered a truly overbought condition, and a below 10 MFI is considered a truly oversold condition.
However, the MFI beyond 90 and less than 10 occur rarely and suggest that a price movement is not sustainable. Many securities trade in the exchange market without reaching the price extremes of the 90/10 level.
Divergence signals occur if the indications from the price action and the MFI are the opposite. The difference in the indications can be regarded as an upcoming reversal. Specifically, there are two types of divergences:
It occurs when the price changes to a new low, whereas, the MFI indicates a higher low showing a boost in money flow. It implies that the selling pressure is decreasing, and buyers will be taking over the market. It presents an opportunity of buying the securities at low prices.
It occurs when the price shifts to a new high while the MFI indicates a lower high. It signifies the decrease in buying pressure and the time for sellers to take over the market. It is an opportunity for sellers to make profits.
Like divergences, failure swings can also result in a reversal in price. However, failure swings do not depend on price and completely rely on the MFI. There are four steps in failure swings in both types of failure swings — bullish and bearish.
Step 1: MFI decreases below 20 (oversold)
Step 2: MFI recovers and rises above 20
Step 3: MFI decreases but stays above 20
Step 4: MFI shoots above the previous high
Step 1: MFI increases above 80 (overbought)
Step 2: MFI drops below 80
Step 3: MFI slightly increases but stays below 80
Step 4: MFI drops below the previous low


