CONFIDENCE.NORM Function
Calculates the confidence interval for a population mean
What is the CONFIDENCE.NORM Function?
The CONFIDENCE.NORM Function[1] is categorized underExcel Statistical functions. It will use the normal distribution to calculate and return the confidence interval for a population mean. The confidence interval is the range that a population parameter is likely to fall into for a given probability.
In financial analysis, the CONFIDENCE.NORM function is useful in predicting and adjusting for a wide range of financial goals by optimizing financial decision-making. It is done by applying and graphically mapping financial data into a distribution set of variables.
Analysts can make better financial decisions based on the statistical information provided by the normal distribution. For example, they can find the connection between income earned and income expended on luxury items.
The CONFIDENCE.NORM function was introduced in MS Excel 2010, replacing the CONFIDENCE function, although the latter is still available for compatibility purposes.
Formula
=CONFIDENCE.NORM(alpha,standard_dev,size)
The function uses the following argument:
- Alpha (required argument) – This is the significance level used to compute the confidence level. The significance level is equal to 1– confidence level. So, a significance level of 0.05 is equal to a 95% confidence level.
- Standard_dev (required argument) – This is the standard deviation for the data range.
- Size (required argument) – The sample size.
To calculate the confidence interval for a population mean, the returned confidence value must then be added to and subtracted from the sample mean. For example, for the sample mean x:
Confidence Interval = x ± CONFIDENCE
How to use the Function in Excel?
To understand the uses of the CONFIDENCE.NORM function, let’s consider an example:
Example
Suppose we know that the mean salary of CEOs in our industry is $100,000. We can use the CONFIDENCE.NORM function to calculate how close the sample mean is to the actual population mean, specifically, if we wish to know what range of salaries, working at a 95% confidence level, includes the population mean. Using the data below:
- Significance level: 0.05
- Standard deviation of the population: 20,000
- Sample size: 100
The CONFIDENCE.NORM function is used to calculate the confidence interval with a significance of 0.05 (i.e. a confidence level of 95%).
To find out the confidence interval for the population mean, we will use the following formula:
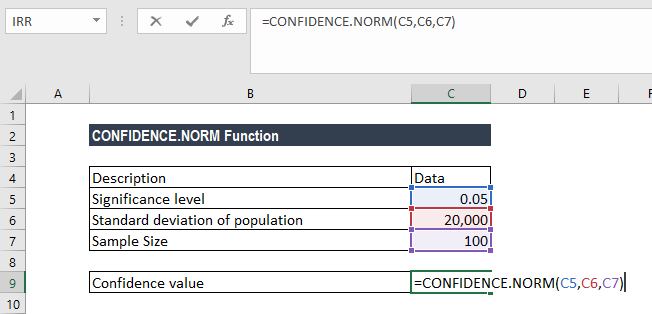
We get the result below:
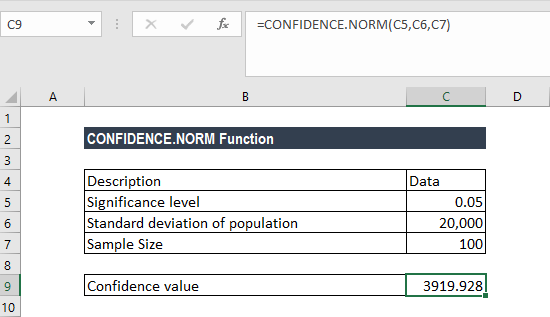
Therefore, the confidence interval is 100,000 ± 3919.928, which is equal to the range 96,080.072 and 103,919.928.
A few notes about the CONFIDENCE.NORM Function
- #NUM! error – Occurs if either:
- The given alpha is less than or equal to zero or is greater than or equal to 1.
- The given standard deviation is less than or equal to zero.
- The size argument given is less than one.
- #VALUE! error – Occurs when any of the arguments provided is non-numeric.
- If the size argument is not an integer, it is truncated.
Click here to download the sample Excel file
Additional Resources
Thanks for reading CFI’s guide to important Excel functions! By taking the time to learn and master these functions, you’ll significantly speed up your financial analysis. To learn more, check out these additional CFI resources:
- Excel Countif Not Blank
- Advanced Excel Course
- Advanced Excel Formulas
- CONFIDENCE.T Function
- See all Excel resources
Article Sources
Excel Tutorial
To master the art of Excel, check out CFI’s Excel Crash Course, which teaches you how to become an Excel power user. Learn the most important formulas, functions, and shortcuts to become confident in your financial analysis.

Launch CFI’s Excel Crash Course now to take your career to the next level and move up the ladder!


