CONFIDENCE.T Function
Calculates the confidence value for the confidence interval of a population mean
T Confidence Interval in Excel
The T Confidence Interval Function[1] is categorized under Excel Statistical functions. The function calculates the confidence value that can be used to construct the confidence interval for a population mean for a supplied probability and sample size. It is often used in determining the t value for a 95 confidence interval.
As a financial analyst, the CONFIDENCE.T function is useful in predicting the value-at-risk for a given portfolio.
T Confidence Interval Formula
=CONFIDENCE.T(alpha,standard_dev,size)
The function uses the following arguments:
- Alpha (required argument) – This is the significance level used to compute the confidence level. The significance level is equal to 1– confidence level. So, a significance level of 0.05 is equal to a 95% confidence level.
- Standard_dev (required argument) – This is the population standard deviation for the data range. It is assumed that we know it.
- Size (required argument) – This is the sample size.
To calculate the confidence interval for a population mean, the returned confidence value must then be added to and subtracted from the sample mean. For example, for the sample mean x:
Confidence Interval = x ± CONFIDENCE
How to use the CONFIDENCE.T Function in Excel?
To understand the uses of CONFIDENCE.T function, let’s consider an example:
Example
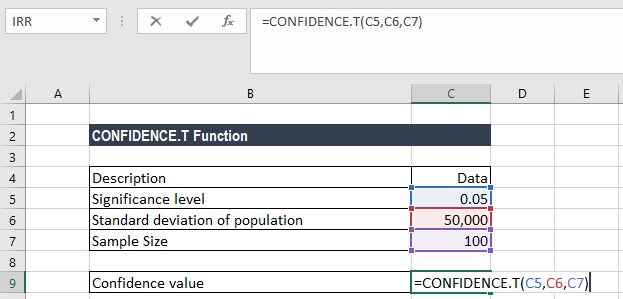
Suppose we know the mean salary of CEOs in the healthcare industry is $200,000. We can use the CONFIDENCE.T function if we wish to calculate how close this sample mean is to the actual population mean, specifically, if we want to know what range of salaries, working at a 95% confidence level, includes the population mean. Using the data below:
- Significance level: 0.05 (i.e. 95% confidence)
- Standard deviation of the population: 50,000
- Sample size: 100
The CONFIDENCE.T function is used to calculate the confidence interval with a significance of 0.05 (i.e., a confidence level of 95%).
To find out the confidence interval for the population mean, we will use the following formula:
We get the result below:
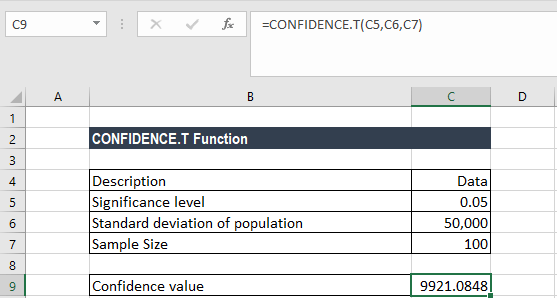
Therefore, the confidence interval is 200,000 ± 9921.0848, which is equal to the range 190,078.9152 and 209,921.0852.
Notes about the Function
- #NUM! error – Occurs if either:
- The given alpha is less than or equal to zero or is greater than or equal to 1.
- The given standard deviation is less than or equal to zero.
- The size argument given is less than one.
- #VALUE! error – Occurs when any of the argument provided is non-numeric
- #DIV/0! error – Occurs when the size argument is equal to 1.
- If the size argument is not an integer, it is truncated.
Click here to download the sample Excel file
Additional Resources
Thanks for reading CFI’s guide to important Excel functions! By taking the time to learn and master these functions, you’ll significantly speed up your financial analysis. To learn more, check out these additional CFI resources:
- Advanced Excel Formulas You Must Know
- Excel Shortcuts for PC and Mac
- CONFIDENCE Function
- CONFIDENCE.NORM Function
- See all Excel resources
Article Sources
Excel Tutorial
To master the art of Excel, check out CFI’s Excel Crash Course, which teaches you how to become an Excel power user. Learn the most important formulas, functions, and shortcuts to become confident in your financial analysis.

Launch CFI’s Excel Crash Course now to take your career to the next level and move up the ladder!


