Get Certified for
Capital Markets (CMSA®)
From equities and fixed income to derivatives, the CMSA certification bridges the gap from where you are now to where you want to be — a world-class capital markets analyst.
A technical momentum indicator used to identify a stock’s trend by looking at the moving average of the difference between a stock’s closing and opening price
The Qstick indicator, developed by Tushar Chande, is a technical momentum indicator used to identify a stock’s trend by looking at the moving average of the difference between a stock’s closing and opening price. To generate insight, the Qstick indicator is generally calculated over a specified period of time.
The calculation of the Qstick indicator depends on the desired chart time frame, moving average length, and type of moving average.
The Qstick indicator is calculated by taking an “n” period moving average of the difference between the closing and opening prices of a stock. The calculation of the indicator is best understood through an example, as provided below.
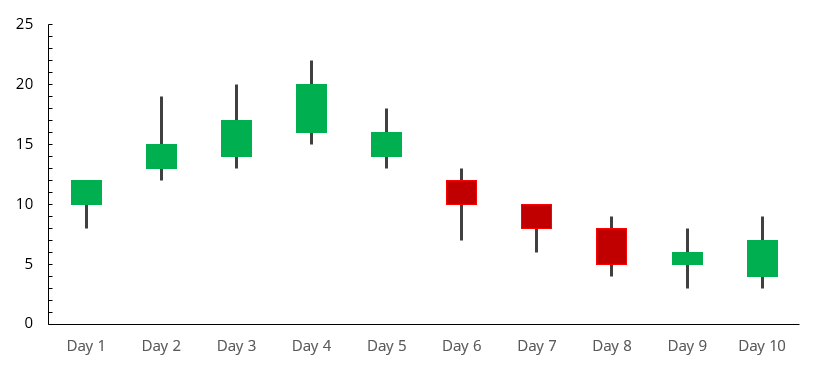
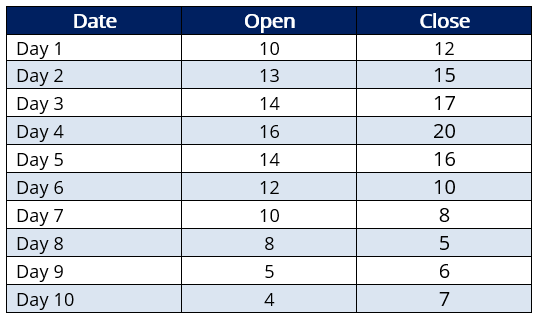
The following shows the daily candlesticks and associated dataset for Stock A:
Below, we will calculate the two-day simple moving average for Stock A. As such, the key parameters for our Qstick indicator:
The construction of the Qstick indicator is provided below:
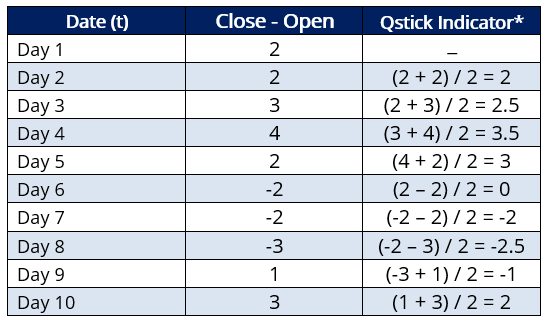
*Given a simple moving average length of two days, calculation of the Qstick indicator on “t” day would be ([Close-Open]t + [Close – Open]t-1) / 2. For illustrative purposes, if we change the simple moving average length to four days, calculation of the Qstick indicator on “t” day would be ([Close-Open]t + [Close – Open]t-1 + [Close – Open]t-2 + [Close – Open]t-3) / 4
Plotting the values of the Qstick indicator would yield the following chart, which is commonly used in technical analysis:
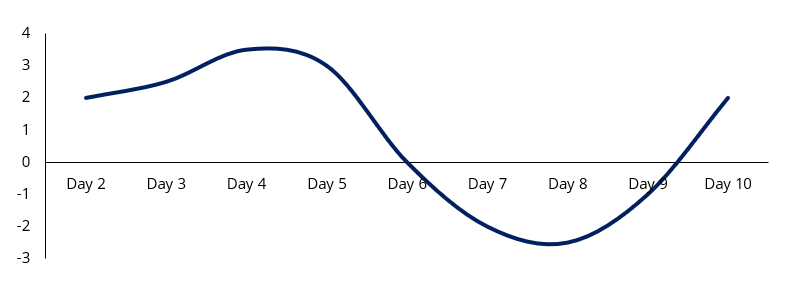
After seeing how the Qstick indicator is calculated, how do you interpret it?
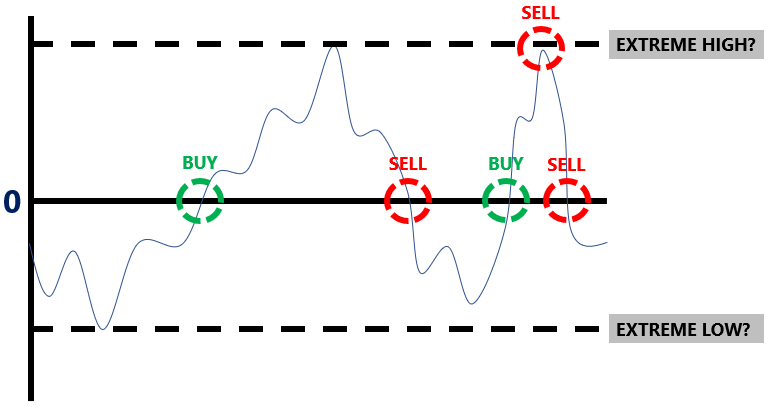
In technical analysis, a Qstick indicator > 0 indicates increasing buying pressure, and a Qstick indicator < 0 indicates increasing selling pressure. Through plotting the Qstick indicator, trends can be identified. As such:
Furthermore, it is common for traders to identify extreme highs and lows of a Qstick indicator plot to identify entry/exit points:
Lastly, divergences can be spotted by comparing the Qstick indicator with the associated stock price.
Although the Qstick indicator can provide BUY and SELL signals, it is not advised to base a trading decision solely on the technical indicator. Other indicators (such as the MACD, RSI, Klinger Volume Oscillator) should be used in conjunction with the Qstick indicator.
CFI offers the Capital Markets & Securities Analyst (CMSA)® certification program for those looking to take their careers to the next level. To keep learning and developing your knowledge base, please explore the additional relevant resources below:


