Get Certified for
Business Intelligence (BIDA®)
Develop analytical superpowers by learning how to use programming and data analytics tools such as VBA, Python, Tableau, Power BI, Power Query, and more.
A measurement of the frequency of a specific event over a defined period of time
The incidence rate or incidence measures the frequency of a specific event over a defined period of time. In business, determining an incidence rate can be done through gathering samples, conducting surveys, and testing products.

Incidence is generally expressed as the number of cases per person per year of examination. For example, a survey can be used to calculate the incidence rate of the number of businesses that were forced to default during the pandemic. It is a very powerful tool, as it easily allows users to analyze the likelihood of occurrences for specific events in a specific time period.
Commonly, incidence is used to determine real-world statistics, such as disease frequency and population risk, but can be a valuable tool to help determine business-related statistical data such as foreclosures.
Gaining information on incidence is crucial because it helps analysts determine approximately the number of times an event may occur in the future and allows them to anticipate these events.
Incidence refers to a frequency measurement that examines the occurrence of specific events within a specified period of time. On the other hand, prevalence is a frequency measurement that examines the total occurrence of events throughout a period of time.
The primary difference in mention is the examination of events. For example, incidence would research the number of bankruptcies over a period of time, while prevalence would depict the total amount of bankruptcies added together.
Incidence alludes to risk assessment, while prevalence alludes to totality.
Apart from the epidemiology definition, incidence rate measures the occurrence or percentage of individuals who are eligible to participate in a study.
For example, in a study of Canadians, if the eligibility of research is defined as people who own Apple products, then the incidence rate is the percentage of Canadians who currently own that brand.
The formula would look something like the following:
Or, in most basic terms:

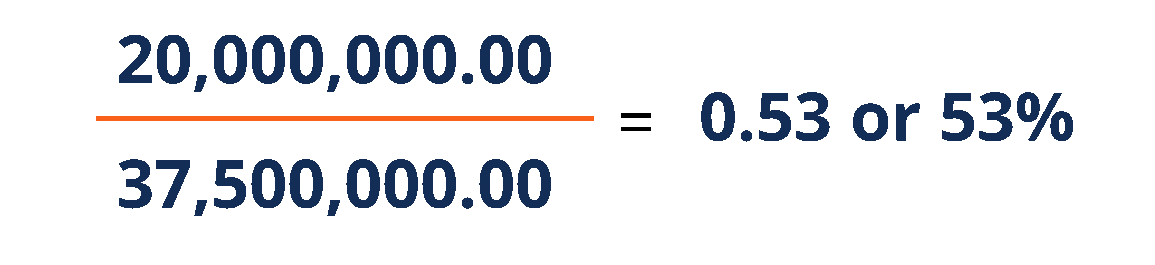
The result of the formula above would depict the percentage of Canadians who own an Apple product out of the total population.
With the approximate population of 37.5 million and assuming about 20 million of the population owns an Apple product, the calculation would go as follows:
In order to grasp the slight difference between incidence and prevalence, we will use an extensive example that showcases the main difference between the two.
Consider the following example:
There is a sample of 500 U.S. businesses, and we would like to measure the incidence rate of businesses that were forced to end operations during a 10-year period.
The necessary information from the 10-year study includes:
Using prevalence with the information above, the analysts would simply take the total number of bankruptcies (3+15+14=32) and divide it by the sample size of 300.
The result would be a prevalence of 10.66% (32/300) for businesses that went bankrupt during the 10-year period.
As for measuring incidence, it becomes a lot more tedious.
It is because the researcher must take into account how many years each researcher contributed to the study and the exact point each business faced foreclosure. The information would need to be altered but let’s assume it would look something like the following:
As it may be aware, incidence is a much more accurate way to examine risk compared to prevalence.
The mathematical difference is not much, but it carries huge implications.
Thank you for reading CFI’s guide to Incidence Rate. To keep learning and developing your knowledge base, please explore the additional relevant resources below:


